We finally have the final turnout data for Florida, so I wanted to go over the final findings.
The voterfile from the state has election records for 7.7 million votes cast. While there are a few tens of thousands not accounted for (largely due to final updates, errors in matching voter IDs, people already moving, or so on), each county has over 98% of its records accounted for, so I am moving ahead with a final report.
You can read previous election reports from in my archives, but two turnout-based posts were these. That said, my archives have far more 2022 election items.
Historic Turnout Gap - Data from right after the election
January Turnout Report - A look at turnout data for districts that we had completed reports for
Those articles include additional data points I won’t be repeating here, so if there anything more specific you’d like, check there first in case I covered it already.
Makeup of the Electorate
Lets start with the makeup of the electorate that cast ballots. Despite being well only 52% white via census data, Florida’s white voters still punch well past their weight. The electorate voting was 71% white, 13% Hispanic, and 10% black.
Hispanic and black voters fell below their registration share (more on that further down). The Hispanic turnout in central Florida was very weak, while black turnout was down across the state.
In terms of partisan makeup, as covered before, Florida’s vote cast came out to 45% registered Republican, 33% registered Democrat; far higher than the narrow GOP registration advantage. This was an unprecedented gap in share of the vote. The 12 point gap in votes cast share blew past 2014’s 3% gap.
So what we have is a heavily Republican-leaning electorate.
Turnout
This is not news to anyone, but Florida’s turnout was very lopsided in favor of Republicans. Below is the precinct map of turnout for Florida. The area’s under 50% are easy to spot and in most instances are in Democratic-heavy areas.
You can see that same turnout breakdown by state house district below.
You will notice in the title of the precinct map that I include both “active and inactive” voters. What is this? For those who don’t know, Florida has it set up where if you don’t vote for several years you can fall on the ‘inactive’ list. Inactive people can vote, but its the first step toward removal. The state’s official turnout report only includes active voters in its registration report (which effects turnout as a %). For example, the state’s official turnout is 53%, because the 7.7 million is divided by only active registered voters. Since I am using inactive for this final report (which should be the norm as inactive CAN vote), then my turnout figure is now at 50%.
A few counties are effected by this active/inactive issue more than others. Okaloosa is hit the most, largely due to large military presence and there can be a constant cycle in and out of people (similar to college campuses). This leaves a longer list of inactives who eventually fall off the roll. Okaloosa has ALOT of inactive voters, which means its turnout % is actually lower - 46% when looking at the full voterfile, and not 56% like the state report says. Most counties, however, see less than a 5% drop in turnout regardless.
Why include the inactive voters then? Because while we can venture why many folks are inactive, we can’t say for sure, and anyone inactive could move back and vote. If they are on the rolls, they are counted for this report.
So turnout was 50%. How was it for the parties? Well, Republican turnout was a respectable 63%, while Democrats were all the way down at 49%. Independent voters were all the way down at 35%.
Looking at race, white voters had 58% turnout, allowing them to go from 61% of registration to 71% of the vote cast. All other racial groups lost ground.
Finally, by age, it was older voters who punched past their weight. 65+ voters made up 40% of the vote cast, with another 30% coming from those over 50-64. Youth turnout, sadly, was all the way down at 24% range.
The age turnout isn’t shocking when we look at turnout by the college campuses. Below is turnout by race and age.
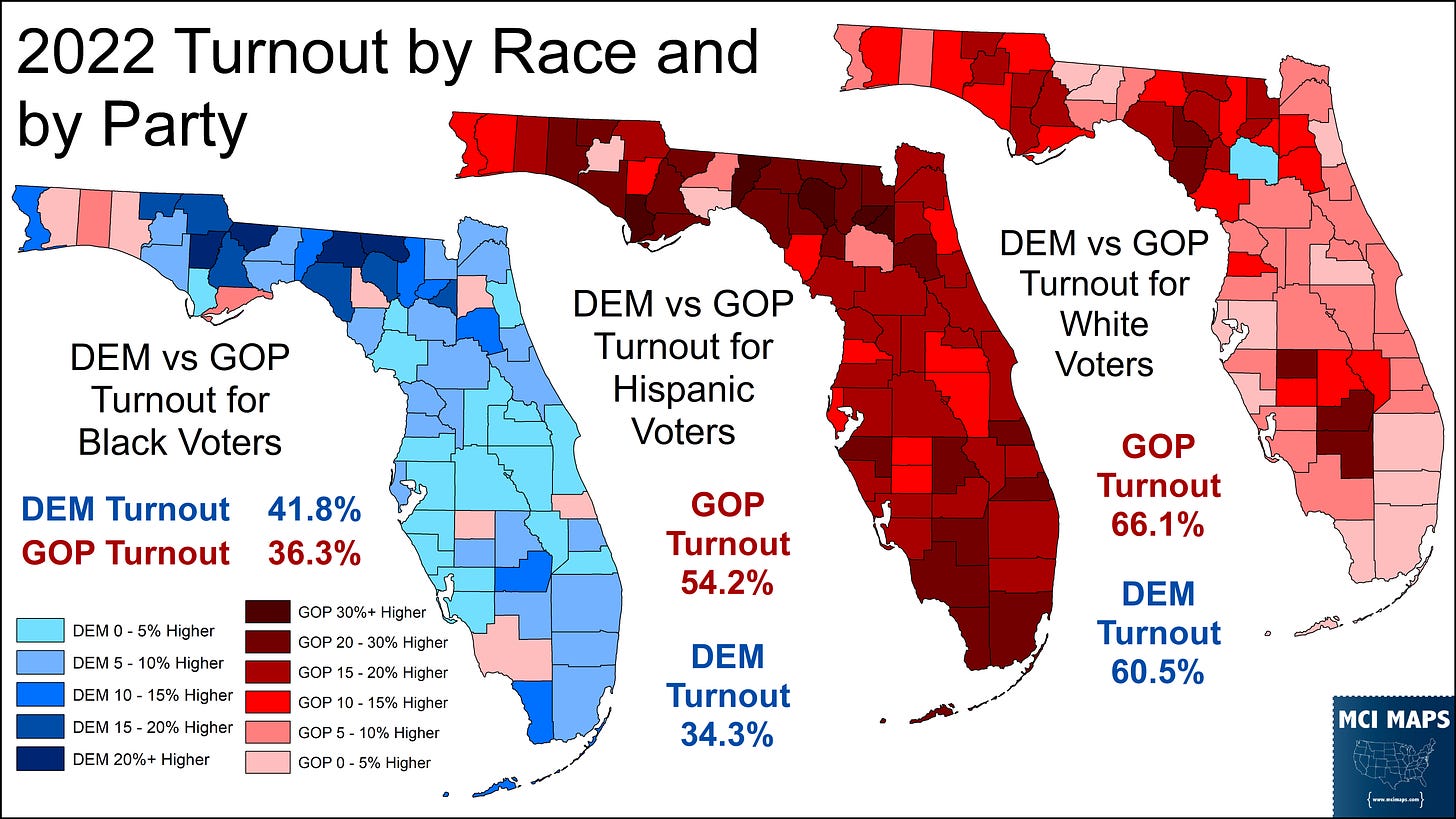
So while Republican’s did have turnout 15 points higher than Democrats, that gap was not even across the state. Below is a precinct map showing the turnout gap between the parties. Red = GOP turnout was higher, blue = DEM turnout was higher.
As the map shows, there were areas where democrats outpaced Republicans; or kept the gap very small. The biggest democrat edges came in African-American areas.
Here is a set of tables showing turnout by party between the respective racial groups. The tables tell a very important story. Among black voters, Democrats outpaced the GOP, while with white voters the GOP edge was modest. But among Hispanic voters, the gap was MASSIVE in favor of the GOP.
While Democrats can be happy about their edge with black voters in terms of turnout, they cannot be happy that black turnout was only 37%.
I broke down the racial turnout gap by county below. As it shows, Alachua county was the only county where white Democrats outpaced white Republican turnout. With Hispanics, not a single county had stronger Democratic turnout. With black voters, most counties saw stronger DEM turnout.
Black democratic turnout was strong in the panhandle. CD2, the racial gerrymander drawn by Ron DeSantis, had Congress Al Lawson running there, and sure enough CD2 had much stronger black turnout that the rest of the state. Keep an eye out for a detailed look at the Lawson run and the DeSantis gerrymander. I’m working on a post about that for the next couple weeks.
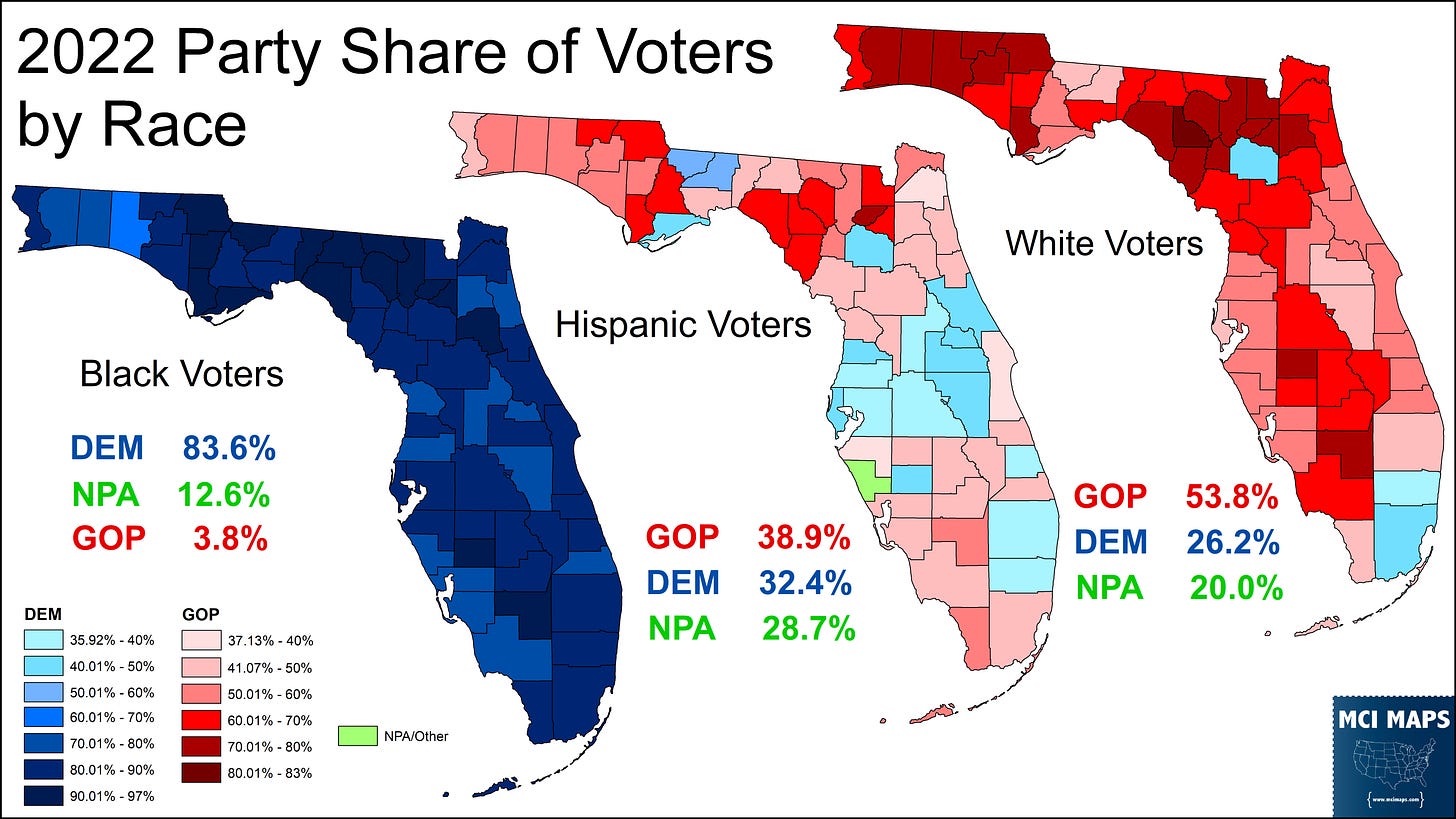
Here is a map of the party makeup by racial group and by county.
Perhaps no shock to anyone, but with black voters, all counties were overwhelmingly Democratic. With Hispanic voters, the Democratic edge in the I-4 can still be seen, even with the horrible democratic turnout. Among white voters, Democrats led in Alachua, Broward, and yep - Miami-Dade. I swear, Dade is a more unique county than people realize.
Parties Moving Forward
So 2022 is in the rear view mirror. Both parties are looking ahead to 2024, and both have new chairs. Republicans elected Christian Ziegler chair a few weeks ago. You can read my background on there here. Though the ballot results are secret.
Democrats, meanwhile, elected Nikki Fried their chair just over a week ago. The breakdown of that vote, which saw her edge out Annette Taddeo, is below.
If you need a background on how that chair’s election worked, click here for the details.
Democrats are in a massive hole heading into 2024. Fried herself is not overplaying expectations. Democrats are very unlikely to reverse this all in once cycle, and will enter a period of statewide rebuilding while also focusing on specific districts for next year.
We will see how it all goes.


Matthew: Another terrific post -- But I do have one important question.
Do you have ACTIVE registered voter counts by age groups also that you could share?
In my own experience as an elected official -- I was Oregon Secretary of State (1991-99) -- as campaigns get down to the final stretch their GOTV efforts are far more focused on actual voters rather than theoretical ones. (And most "inactive voters" are so classified NOT because they've gone quiet; the vast majority are so classified because they seem to have moved and haven't updated their records yet).
Having active RV counts would also allow better comparisons with a number of other states. Thank you!
Very constructive,. Do the voting records show how many Republican voters are recent residents?