Issue #92: New Turnout Data Highlights
Big focus on Hispanic Turnout
After the 2022 elections in Florida, which were a massive GOP landslide, I wrote about the historic Republican turnout advantage in the state. That year, Republicans had a 15% GOP advantage in turnout, the party share of vote cast was 45% GOP vs just 33% DEM.
This partisan makeup and its turnout were unprecedented in modern Florida.
Since that article, we have begun to get person-by-person records of who did or didn’t vote. As of now, we have 94% of the vote cast recorded in the voterfile. Meanwhile, the updated voterfile being sent out as I write will likely include the final figures. But as I wait on that, I wanted to share some notable stats based on the data I do have. Note, all figures I show will be excluding the handful of counties (most of them medium to small) that have not finalized their voter list.
Turnout by Race and Party
The voterfile updates have finally allowed us to look at voter turnout by race. The data shows what I and others long suspected, a very big gap between white and non-white voters. While white turnout as 58%, it was only 36-37% for both Hispanic and black voters.
The Hispanic collapse in turnout in the Orlando region (where Hispanics lean much more Democratic) led to several legislative “likely dem” losses. Meanwhile, almost every precinct map I have made so far shows much weaker turnout in the African-American community.
Now if we break down race and party turnout, some interesting data points show up. Among black voters, Democratic turnout was actually stronger than it was with Republicans (which is granted a small figure). With white voters, the partisan gap isn’t as horrid as the statewide figures overall - just under 6%. But among the Hispanic voting base - a MASSIVE partisan difference.
Hispanic Republicans had far greater turnout than Hispanic Democrats. Meanwhile, Hispanic NPAs, who’s partisan allegiance can vary by region, had a dismal 27%. Based on the partisan data, I would venture than the NPAs who are showing do lean more conservative. Overall we are seeing a Hispanic electorate far more conservative than the registration suggests.
Hispanic turnout is actually something I plan to discuss much more in this post, as it heavily impacted Democratic fortunes around Orlando.
Congressional District 9
One of the more shocking results out of 2022 in FL was how close the 9th Congressional district, a majority-Hispanic seat around Orlando, was. Darren Soto had a closer-than-expected 7% win while Ron DeSantis narrowly carried the district.
While Orange County overall remained Democratic, Osceola notably flipped red in the Senate and Gubernatorial contests. Why did this happen? You guessed it. Turnout issue.
Here is turnout by party, by race, and how Hispanic/party turnout broke down.
Republican turnout was a whopping 17 points higher for Republicans than Democrats. Now this still left the blue team with more voters, which makes Crist’s loss there all the more damning. That said, this should have been a democratic landslide had turnout been less lopsided. A very notable fact is despite being plurality Hispanic in registration, the votes cast were almost majority-white!
Among the Hispanic voters who did show up, GOP turnout was much higher, but the electorate still remained heavily Democratic. The Hispanic NPA drop is the most notable.
State Senate Districts
Democratic fortunes in the State Senate were bad. Districts 10, 14, and 38 all voted for Biden, but went to GOP candidates (36 was basically a tie between Biden-Trump, but voted heavily GOP). Meanwhile, Democrats almost got caught in SD25. Here is the party and race turnout for those districts.
Despite none of these having Republicans as their largest party in registration, all but one had more Republican than Democratic votes. Partisan turnout absolutely crushed Democrats here. In addition, SD25, the majority-Hispanic state senate seat around Orlando, like CD9, had more white votes actually cast.
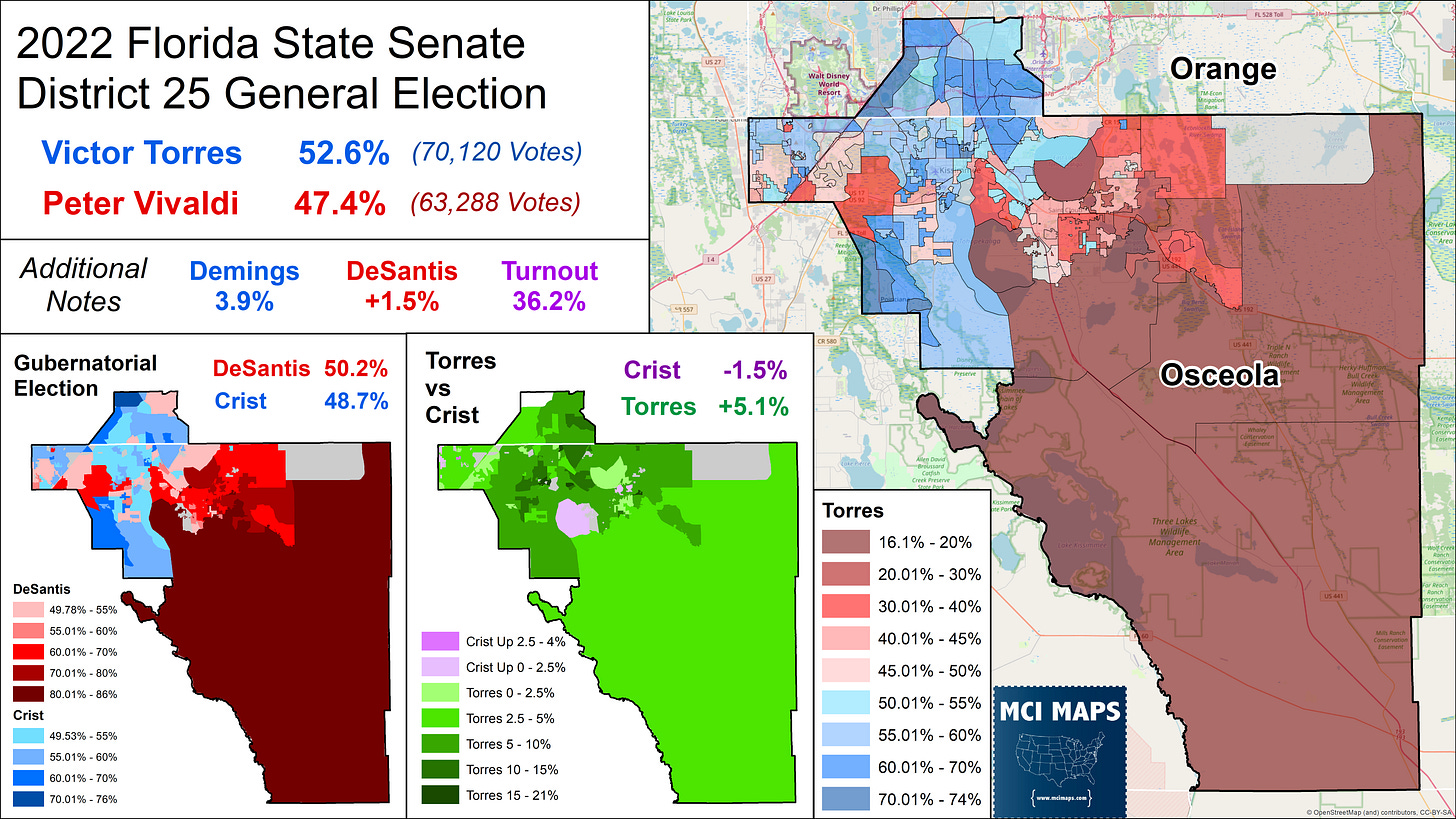
Senate District 25, like CD9, was NOT supposed to be close. The race for this was a total afterthought - and yet Democratic Incumbent Vic Torres only won by 5%. DeSantis, meanwhile, narrowly carried it.
Like CD9, there were more registered Democrats voting, but by a smaller margin than registration would share. The district also was plurality white in voting. Luckily for Democrats, the GOP didn’t pull off an upset.
The State House
There are many state house districts I plan to cover in more detail in the coming weeks/months. That said I want to highlight some the Orlando-area districts. Mapmakers drew House districts 35-47 all within the Orange/Osceola/Seminole county borders. ALL of these seats voted for Biden in 2020. However, when all the results came in, Democrats only held 6 of the 13 seats.
So what is the story here? Well HD30 and 41 are the most steadfast Democratic seats, as they are African-American seats. HD43, 46, and 47 are majority Hispanic, while several others have sizable Hispanic populations. For all these districts, Republican turnout far outpaced Democrats.
Thanks to these turnout dynamics, several seats had more GOP votes than DEM votes cast. Democratic efforts to take several of these seats faltered due to turnout - with the most heartbreaking being Carlos Smith’s loss in HD37. Democrat efforts to take the newly-drawn 47th were killed by a massive drop in democratic share of the vote and a subpar candidate.
On the plus side for democrats here, they have plenty of pickup opportunities. However, this requires SOME reversal of this turnout.
Hispanic House Seats
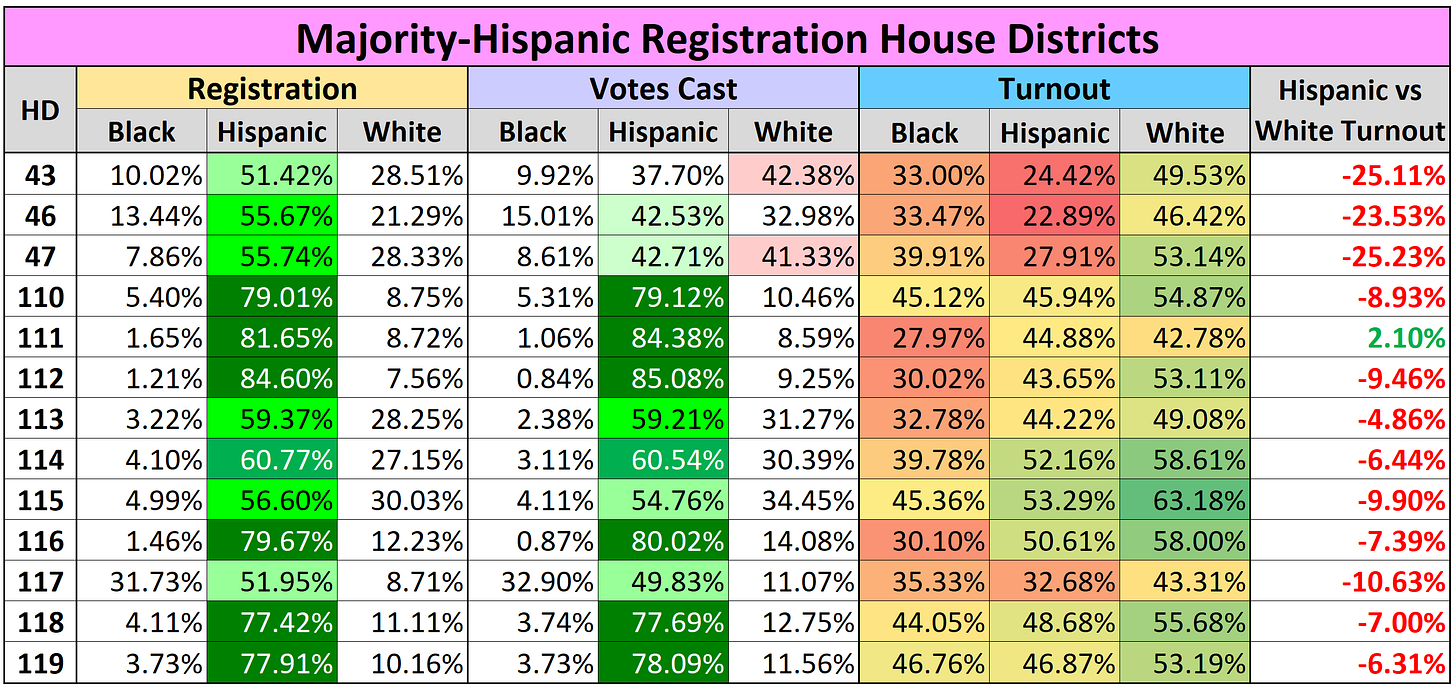
As I’ve discussed with CD9 and SD25, cases will exist where a district is majority-minority in registration, but whiter in terms of votes cast. A further highlight of this, I looked at all the state house seats that are majority-Hispanic in terms of voter registration. Only 43, 46, and 47 are in Orlando - with all the others being in Miami-Dade.
As the table above shows, all but one district had worse Hispanic turnout than white turnout. In the Orlando area, it was especially brutal - with over 20% turnout gaps. The different turnout gaps in Miami-Dade vs Orlando can be reasoned by a few things. However, more data is going to be dug into to examine this further down the line. One culprit that was at least a factor was that the Republican GOTV machine was hard at work in Miami-Dade to turn out the more conservative-minded Hispanic population there. The focus in Orlando was likely more specific to turning out GOP Hispanics (a small group there) and some persuasion. But there is MUCH more Republican-Hispanic turnout infrastructure in Miami-Dade.
Meanwhile in Orlando, where the Hispanic population is heavily Puerto Rican and Democratic-leaning, the DEM machine wasn’t there, so Hispanic DEM turnout was down, which really dragged down Hispanic turnout overall.
One indicator that partisan operations/turnout played a roll can seen in the table below. This table breaks down the same districts, but focuses only on Hispanic voters, and looks at how they broke down by party. In the three Orlando seats, the DEM v GOP turnout gap is there, but its not overwhelming. Meanwhile, in Dade, the GOP turnout is way above Democrats.
So these Dade districts, which as the registration shows, were much more Republican Hispanic than Democratic (unlike Orlando). These Republicans, aided by a GOP machine no doubt, showed up strong. On top of this, the older Cuban exile community is always a reliable voting block. So this boost in GOP Hispanic turnout aided Hispanic turnout overall in these Dade districts. Meanwhile in Orlando, the horrible NPA and DEM turnout among Hispanics dragged the whole Hispanic margin down.
But I also must note the weaker GOP Hispanic turnout in Orlando vs Dade. While party efforts likely played a factor, I also intend to dig into turnout habits between these distinct Hispanic communities over the history. How have the newer-arriving Puerto Rican voters turned out vs Cuban exiles and other Latin American migrants? There is FAR more to dig into on this topic.
Like I said, alot more to dig into here down the line. Trust me, this data has answered some questions, but also posed new ones.
Until next time.


This is excellent analysis; thought-provoking.
Matthew: I'm Oregon's former Secretary of State (Phil Keisling), and this is utterly terrific analysis and presentation. Thank you!!
But I have one question: Have you also broken turnout rates out by AGE as well? (E.g, 18-34, 35-49; 50-64; 65+).
Florida's data, like that from my home state of Oregon, should also exist to presumably do this by age AND party AND geography, too. (And unlike Oregon, you could also do a "4-way" analysis by including voters' presumptive race/ethnicity, adding even more insight into turnout patterns!).
I'd love to see that if you have it, or intend to publish. In the meantime, here's the Oregon data as published by the SoS here in early December.
https://sos.oregon.gov/elections/Documents/statistics/november-2022-statistical-summary-participation.pdf