Well it is February, its almost 3 months since the election, and I finally of precinct maps for Florida. Normally I get these out alot quicker. Why did I take so long? Eh, lack of demand combined with lack of desire. When races are a blowout, their tends to be less interest in detailed maps. I found myself much more interested in working on stuff like the Kentucky Abortion referendum for a few weeks.
You can read all about that here. More work on that is coming.
BUT I finally resolved to get these maps done for Florida. This coincides with me digging into turnout data a few weeks back, which I will be following up on with more updated data in the near future. I am also in the process of breaking down the statewide races by State House and State Senate district. That could be ready fairly soon, though split precinct issues are slowing things down. See below.


But while more analysis and reports are in the works, I wanted to get these precinct maps out now.
Florida’s Electoral Geography
My main website and this substack are full of descriptions of Florida’s red/blue divide. I will not bore you with that here. Florida, whether the Democrat wins or losses, has alot more red on its map than blue. The rural communities are solidly red, unless they are majority-black, while cities for the most part have grown more Democratic. In urban centers in Miami-Dade, Tampa, and Orlando, different demographic coalitions can led to blue and red pockets. For context as we look at 2022, here is the 2020 Presidential precinct map, which had Donald Trump win by just over 3 points.
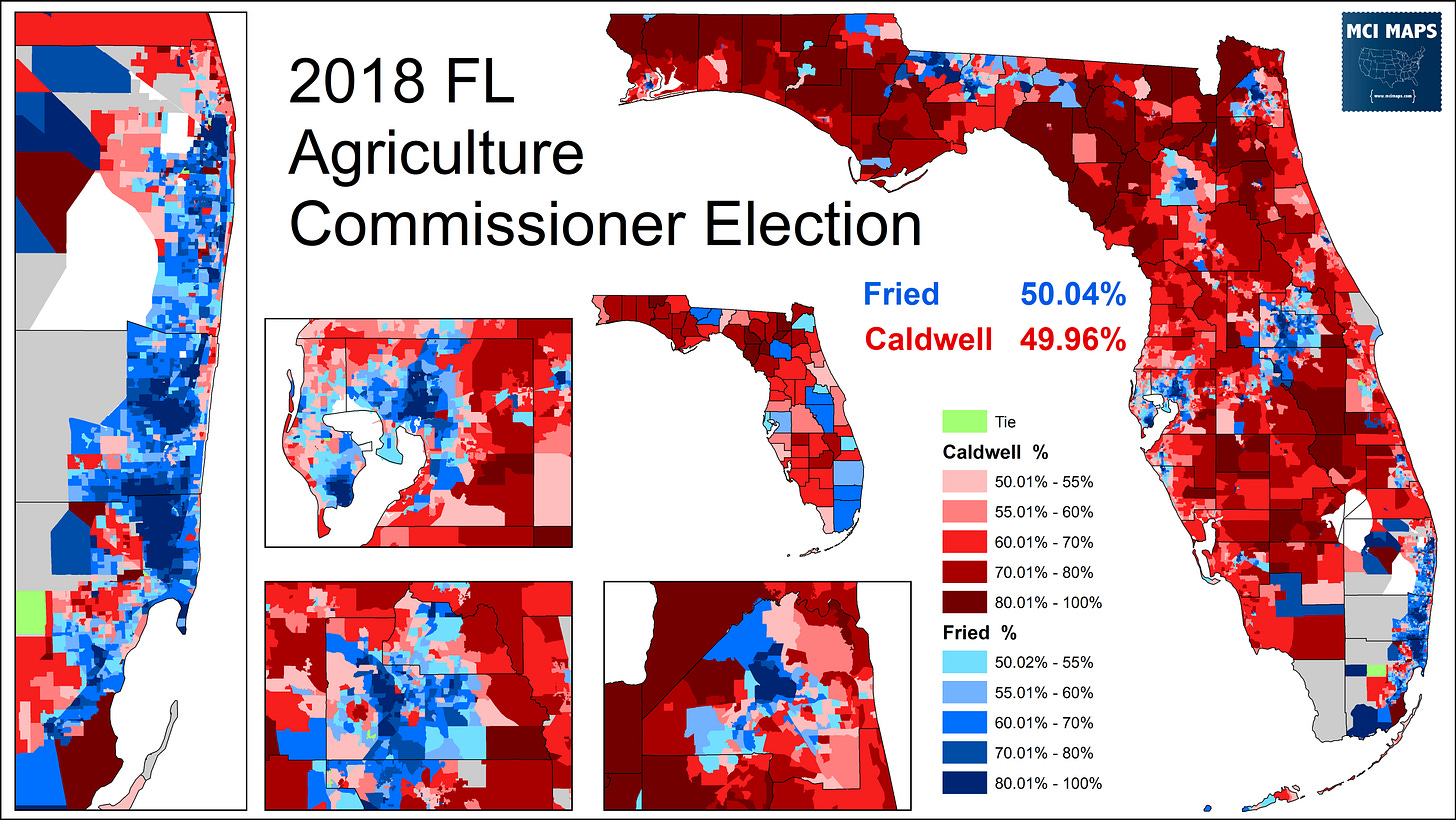
For an example of a Democratic win, see the Nikki Fried 2018 map.
These maps are fairly similar, and the differences come mostly in margins and a batch of flipped precincts. On a quick glance, it probably looks largely the same.
So how did the GOP landslides in 2022 look compared to past years. Well, here is them all.
First, the US Senate contest, which was the closest, but still a blowout. Senator Marco Rubio only led Demings in the polls narrowly for most of the year. However, the lopsided turnout - which I’ve discussed plenty here and here - dragged her down along with the rest of the Democratic slate.
Next up, the Governor’s race. Crist never came as close in polls as Demings, but the 19% win ended up being far outside what public (but not all private) polls showed.
Here is Attorney General, which is the winner for biggest GOP margin. AG Ashley Moody won over former State Attorney Aramis Ayala, who drew national attention for her righteous position to never seek the immoral death penalty.
In the Chief Financial Officer contest, Jimmy Patronis easily bested former State Rep Adam Hattersley.
And finally, in the Agriculture Commissioner contest, Wilton Simpson, who bent the knee to Ron DeSantis during redistricting, easily won.
These maps are all very similar. There was only modest ticket splitting in most races, a product of only hardcore partisans largely turning up to vote. The map below shows the gap in vote margin by precinct, which means the larger gap means more ticket splitting.
The I-4 and Tallahassee regions show more ticket splitting than anywhere else. Several of the biggest split ticket precincts were low-vote-total rural areas (those dark spots you see in Dade or Palm) where one or two voters splitting their ticket can really drive things.
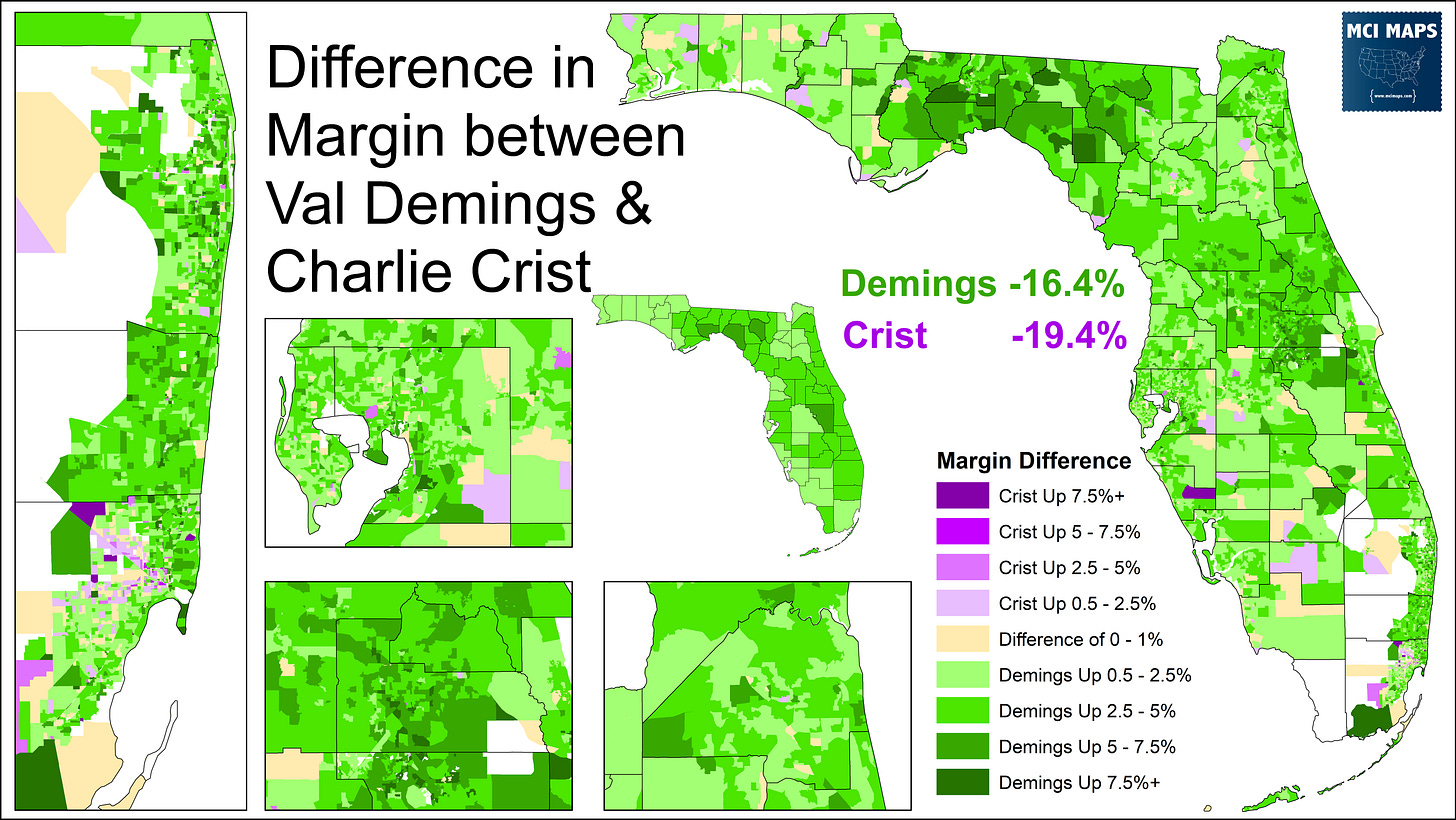
This next map shows the difference in vote margin for the two most high-profile Democrats, Demings and Crist. Demings outperformed Crist across the state, but by the most in the Tallahassee media market. Crist only had scattered areas where he outperformed.
And finally, here is a precinct map of which Democrat for statewide office did best. No shock, but Demings leads in precincts by a wide margin. The other most prominent Democrats were Hattersley and Blemur. There is a notable Blemur cluster in the Panama City area and Hattersley was stronger in the Agriculture heartland.
Ayala was also stronger down in Miami-Dade, specifically in the Cuban community. Blemur, who hails from Miami-Dade and is a member of the Caribbean community, was stronger in Miami-Dade as a whole.
These “best performing” maps can be affected by voter drop-off, old ancestral party loyalties (think old rural Dixiecrats - though this matters less and less each cycle), and which candidates put money into what media market.
Future Maps
As I stated before, I will be working on more breakdowns of the Florida election results and doing more precinct maps. I am working on some turnout maps and will be digging into other issues like the Supreme Court retention votes and analysis of specific district races. The turnout maps are likely to be very revealing - highlighting the sharp democratic vs republican turnout dynamics. So far far farrrrrr more is in the works!
In the meantime, enjoy the colors!


Has anyone looked at the results in the precincts with a large Jewish population?