Issue #88: A look at the 2022 Kentucky Abortion Referendum
Lets talk about abortion in coal country
In the 2022 midterms, voters in several states were presented with ballot measure regarding abortion. In states like California and Michigan, the vote was about enshrining abortion rights into the State Constitutions. In Kentucky, voters were presented with a different measure. The proposal, backed by Republicans and pro-life groups, if passed, would have made it clear that the Kentucky Constitution did not protect the right to an abortion.
This measure, which was similar to the Kansas vote months earlier, failed in Kentucky - a major victory for the pro-choice side.
In the Kentucky Amendment 2 vote, the NO side (aka the pro-choice side) got 52% of the vote. The NO side dominated in Lexington and Louisville, as well as the Cincinnati suburbs. Critically, it also did very well in the towns and counties around these major population centers.
Similar to the Kansas vote, the YES (pro-life) side did not get the strong margins they needed in the rural/GOP areas.
Read more analysis on the Kansas vote here.
While the Kentucky vote was happening, so was the election for United States Senate. Rand Paul’s re-election was never much in doubt, and he won re-election by 23 points.
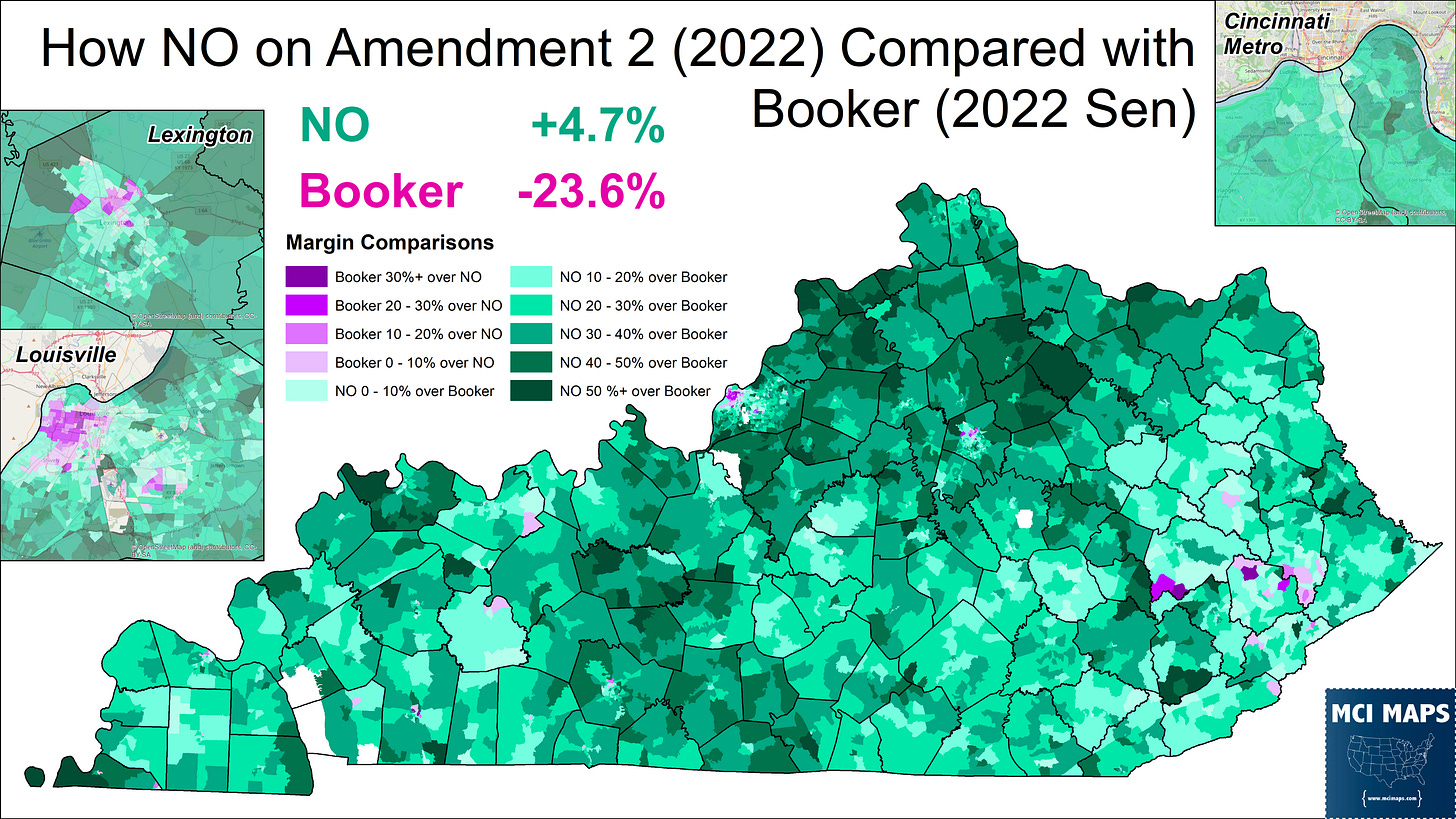
The NO side of the abortion referendum outperformed Booker in every county of the state. Only in some of the coal field counties was the gap close, though even then “close” is a 9% margin difference.
The pro-choice side far outpaced the Democratic ticket. Now, similar to the Kansas vote, it cannot be assume all, or even most, of the Rand Paul - NO voters are pro-choice to a fault. This measure, had it passed, could have given the legislature much more free reign to outright ban abortion or limit it with few exceptions. Horror stories of young rape victims having to travel for abortions can turn off voters who are generally pro-life. Similar to Kansas, voters clearly did not trust the Kentucky legislature to look at the issue with any nuance, even if they favor some restrictions.
Precinct Maps
In the last couple days I managed to finish up precinct maps of these elections. The abortion measure by precinct is below.
The precinct map much better highlights the small towns in many counties that were NO votes. These blue islands were critical for the pro-choice side, as they kept most of the rural counties from being overwhelmingly YES. Only the traditionally DARK RED counties of Southeast Kentucky were overwhelmingly YES. While ancestral Democratic areas like Elliot or Pike were YES votes, they were not by massive margins.
The Kentucky Senate map also shows off the small democrat-cleaning towns in different corners of the state. That said, there is far more red in this map.
The Booker vs NO precinct map shows a VAST VAST majority of precincts gave NO a higher margin than Booker. However, two key types precincts where Booker outperformed NO are visible.
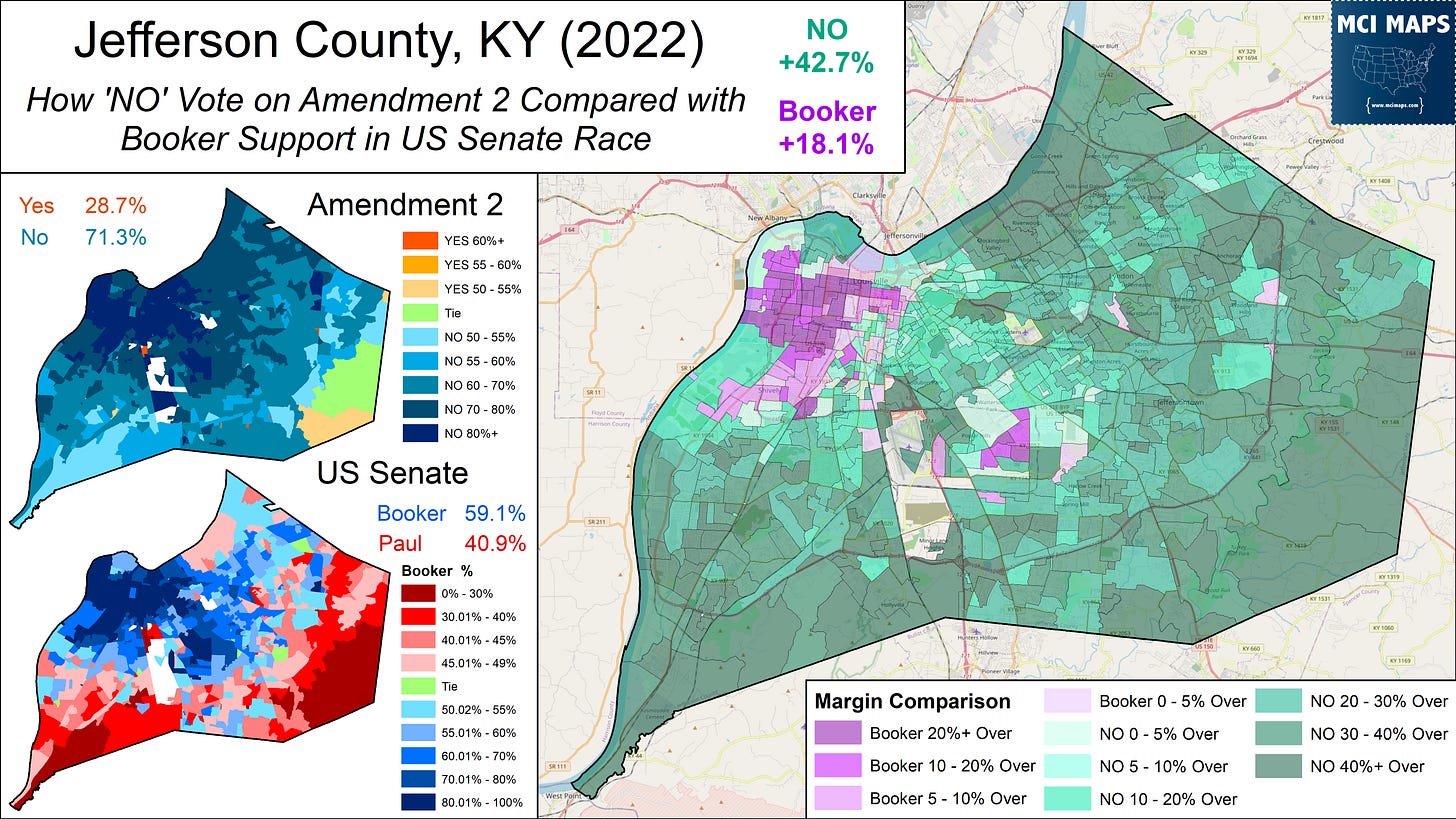
The most glaring on the map is the blocks of precincts in Lexington and Louisville. I actually did a zoomed-in map of Louisville's votes, which you can see below.
The areas here where Booker outperformed NO is the African-American community. In both races, the NO and Booker side did very well in the African-American community, however, the NO margin lagged. This phenomenon, where the pro-choice side underperformed the Democratic ticket, is not uncommon, and was something I saw in the 2012 Florida referendum on abortion.
The other batch of precincts we see Booker doing better in area a handful of coal country precincts. These are just a few, and for the most part are small vote totals. However. these line up with precincts where Booker only did modestly worse. This lines up with a history of the Democratic ticket doing better than abortion rights in coal country in certain cases
Lets highlight this pro-life, coal democrat vote by looking at a race where a Democrat won in Kentucky; the 2019 Gubernatorial election. That year, Attorney General Andy Beshear defeated incumbent Governor Matt Bevin by the narrowest of margins.
So if we compare Beshear’s margin with the NO margin, coal country really stands out as areas were Beshear did much better.
This map really does well at highlight the old coal country, ancestral Democratic base in Appalachia. Eastern Kentucky used to be steadfast Democratic region. Still today many local officials are Democrats. State legislative seats only began really falling to Republicans in the last few years. In 2019, I wrote about the State Senate Seat in the Kentucky coal fields flipping from Democrat to Republican. Look at that ticket splitting.
Democratic strength in the coal fields continue to shrink. Booker continued a trend of Democrats doing worse, which led to him underperforming NO everywhere. A few cycles ago, his vote share likely would have outdid NO in some of these areas. Federal races are especially rough for Democrats in coal country as well.
Whether Gov Beshear wins or loses re-election this year, I can almost guarantee a 2019-2023 swing map will show him losing ground in the coal fields and improving in the suburbs around the big cities. However, many of these voters still remain registered democrat (though by shrinking levels) and many elected local democratic officials just two months ago. These voters are also much more pro-life.
Future Analysis
I am posting the maps above now so they can be viewed by the public. However, my research into the abortion referendum in Kentucky is only beginning. I plan a very detailed deep-dive into the vote by different demographics and regions. I also intend to dig deeper into the 2018 referendum in West Virginia. That measure, the same as the Kentucky one, saw the pro-life side narrowly win; adding an amendment that said you had no right to an abortion.
Kentucky and West Virginia share a border and have politics heavily influenced by the coal fields. My question is, why did West Virginia vote pro-life and Kentucky pro-choice? Was it the horror stories post Dobbs? Was it that Kentucky has more suburbs and cities? After all, there is no Louisville powerhouse in West Virginia.
My intention is my upcoming analysis is to dig into the West Virginia and Kentucky votes. I aim to look at how coal precincts in both states compare, as well as city precincts, suburb precincts, and so on. I aim to answer, as much as is possible, how much Dobbs shifted attitudes in the coal fields, if it did at all.
Also, if all goes according to plan, I intend to have interactive precinct maps for both Kentucky and West Virginia.
So stay tuned, more is in the works.


