Issue #106: The Vibes Around Florida Supreme Court Retention Elections
How voting shifted under a now-Conservative Court
Over the last few months, I have broken down Florida’s 2022 elections. I’ve looked at the turnout issue Democrats had, the effects of the gerrymandered congressional map, and what partisan trends are on display. However, I am not done yet. I am here today to talk about Florida Supreme Court Retention Elections.
NO NO NO - don’t click back. Trust me, its far more fascinating than you think.
These are elections ruled by one thing - vibes.
Backstory
In Florida, the governor appoints Supreme Court Justices. These appointments do not need legislative approval, but also must come from a judicial selection commission. A recently-appointed Justice must then face the voters in a retention election. Justices then face retention every six years. These races are almost always quiet affairs with little or zero money spent.
Until a few years ago, the court was decidedly liberal. Filled with Lawton Chiles and Charlie Crist appointees. In general, the court was viewed as 5-2 liberal around 2016. The court often struck GOP ballot measures or right-wing legislation down. One of the most notable cases was the 5-2 decision striking down the state’s congressional map in 2015.
Due to the court’s left-wing nature, retention votes often saw cities and suburbs vote heavily in favor, but opposition from rural communities. In 2010, this was at its peak, when Justice Labarga, who angered conservatives with his vote to strike an anti-Obamacare amendment from the ballot, saw big losses in the rural counties.
In 2012, Florida Republicans and conservative groups pushed a NO vote on the retention of 3 liberal justices up that year. This forced an actual campaign, with the justices raising money to promote their retention. The move failed, with all justices easily being retained. The 2010 vote was the narrowest in the modern era, but was still 18%. Voters largely opt to retain on default. “If I haven’t heard anything about them, it means they are staying out of trouble” is the common refrain.
But as I documented in my 2017 article, retention votes largely saw rural areas vote against retention, with suburbs (even GOP strongholds) and cities voted to retain. This held true for liberal AND conservative Justices. While Conservatives like Justice Canady would do better than Labarga in the rurals, there was still many NO votes. Conversely, Canady, who was floated by Trump as a possible SCOTUS pick, would still win Democratic cities in his 2016 re-election. This came down to the vibes around the court. While most voters just reflectively vote to retain, hyper-partisan rural conservatives defaulted to reject while hyper-partisan cities voted to retain. These voters knew enough to know the courts balance, but less about individual justices. Only the most hardcore obsessives knew enough to split their tickets - or they were driven to do so with slate cards (more on that later).
Then as the court began to flip the conservatives, thanks to mandatory retirements of the liberal justices, the retention dynamics began to change. In 2021, I covered how a now 6-1 conservative court (only Labarga remains as a liberal-moderate) saw 2020 retention elections shift. Some pockets of opposition in cities emerged, while the rurals moves more towards retention. Read that backstory here.
In 2022, FIVE Justices were up. Jorge Labarga, the last liberal-leaning justice, was up along with conservatives Charles Canady and Ricky Polston. All members during 2015 redistricting ruling. In addition, two new DeSantis appointees, Jamie Grosshans and John Couriel, were facing their first votes. Lets see how these went.
How the 2022 Races Went
Like previous years, these retention elections saw little coverage and no major money campaigns.
Justice Labarga secured 62% in his re-nomination. His opposition largely remained in the rural communities. He won most Democratic city centers, except for the heavily black Central Broward region. Trust me we will get to why some voting pockets seem to vote different from the others.
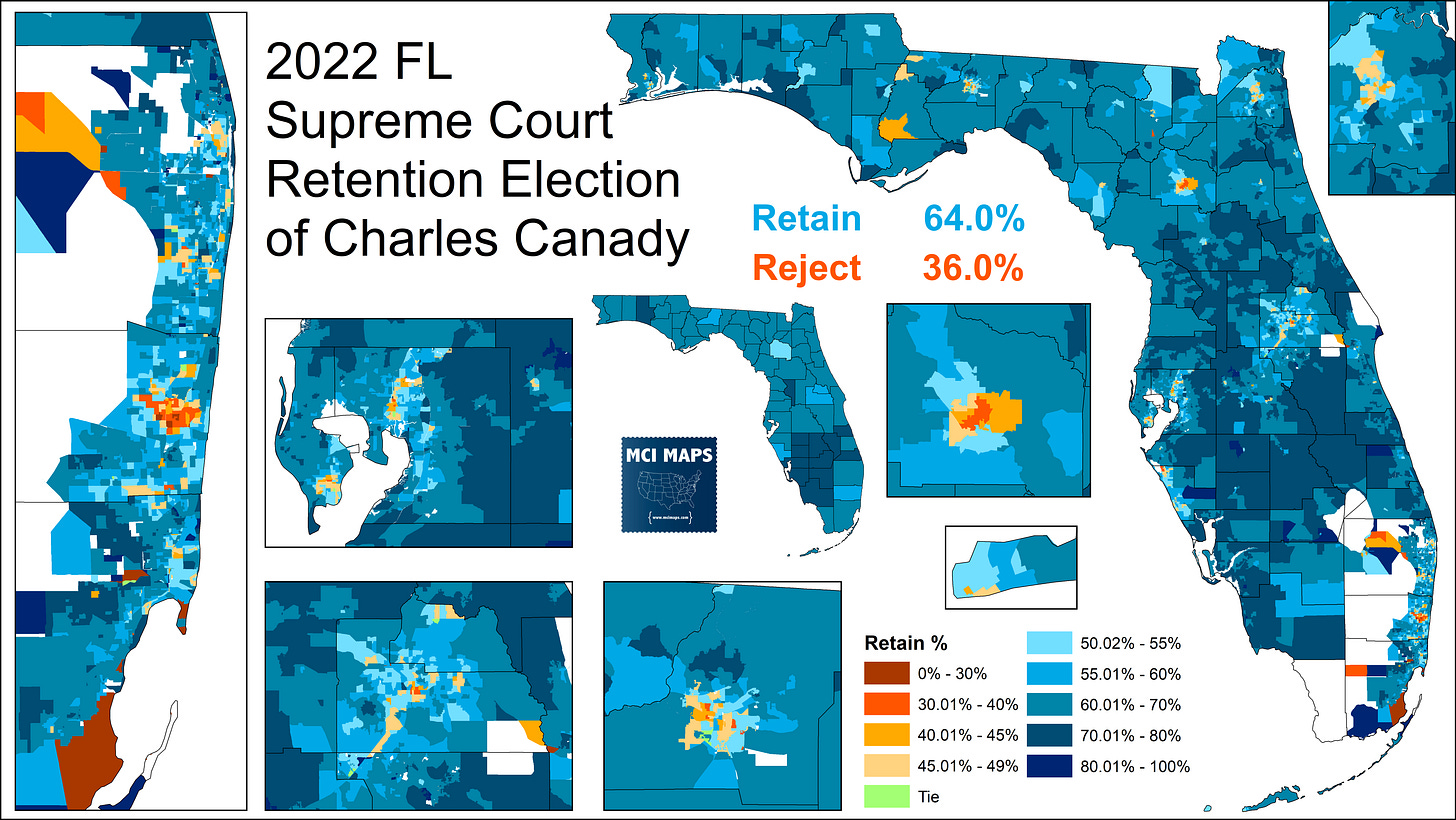
Justice Canady did slightly better, getting 64% and consolidating the rural counties and precincts. However, Canady saw worse showings in Democratic-aligned cities like Gainesville and Tallahassee.
Justice Polston had a map very similar to Canady, a consolidation of rurals but doing worse in the cities.
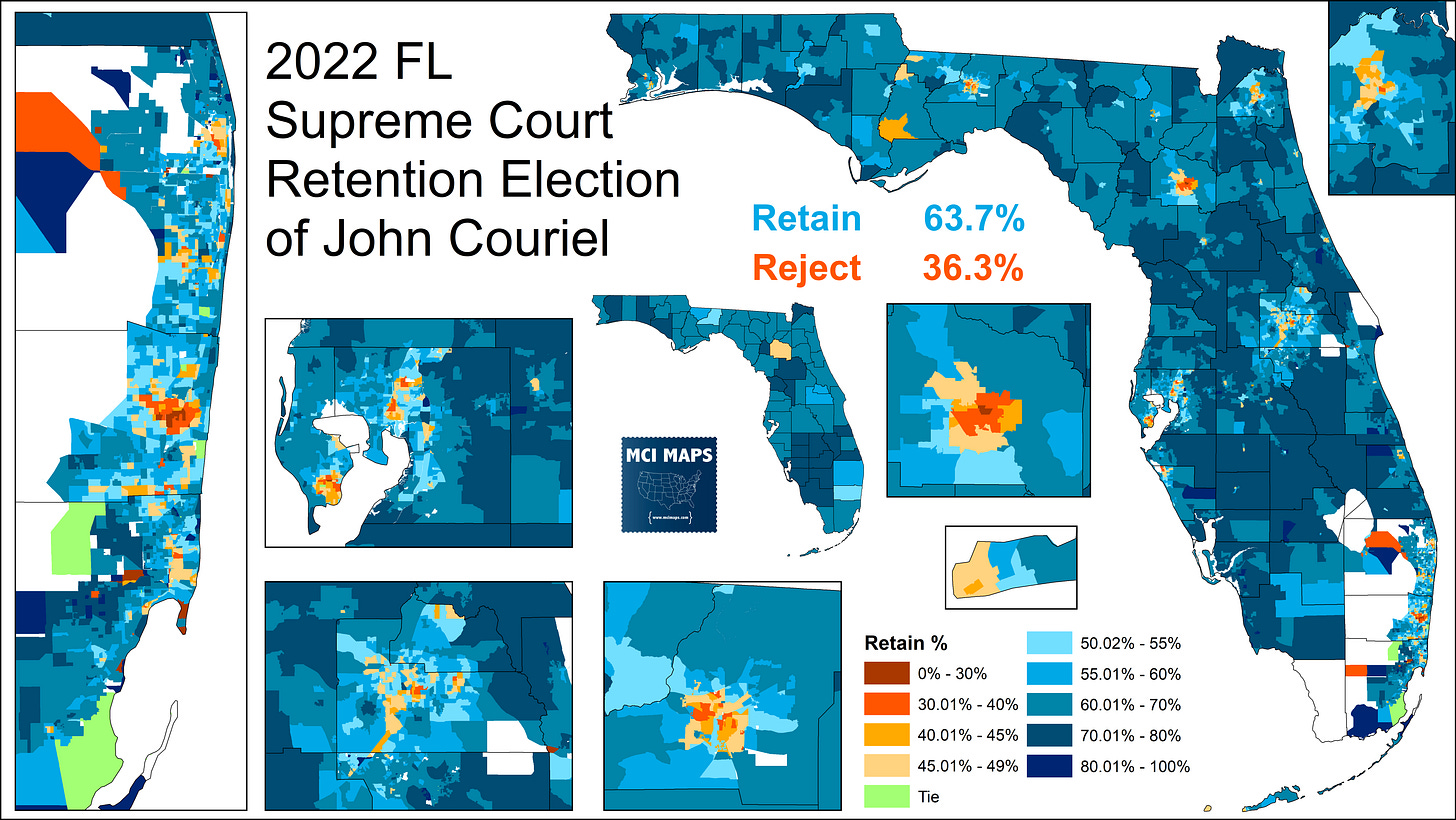
Justice Grosshans had similar results to Canady and Polston, but did slightly worse in Gainesville - allowing Alachua to flip to rejection.
The same story is true for Justice Couriel. In fact, Couriel and Grosshans had near-identical vote share - with most precincts being within 1% or 2% difference for the newcomers.
Canady and Labarga are probably the most high-profile Justices. How did they compare to each-other? Here is where we can see the the ideology difference effecting some voters. Labarga does miles better in more Dem-aligned areas, while Canady does far better in rural and conservative pockets. Even spot how Canady outperforms Miami-Dade’s Cuban community.
This map highlights that while many voters are not casting pure ideological votes in these elections - their is an undercurrent among some that shape who does better and where. These differences in share by precinct are shaped by those super-engaged voters.
One final point of comparison. Canady, despite getting a higher statewide share of the vote than Ron DeSantis, still underperformed the governor in much of the rural communities. Meanwhile, cities and suburbs backed the conservative Justice more.
A similar map for Canady v Trump is in my 2021 article on retention. As this shows, there were many Retain-Crist and Reject-DeSantis voters.
Swings in Retention Support
While the different vote shares for liberal vs conservative justices stands out, what is more striking is the swing in votes since 2016. Labarga, Canady, and Polston all faced voters in 2016. How their shares changed by county reveals how many voters are simply relying on the “vibe” that the court is more conservative. I mapped the county-swing for all three of these justices.
Canady and Polston, both conservatives, saw very similar stories - doing worse (violet) in Democratic centers and better (green) in rural communities.
I didn’t include a Polston swing map because this article is already at the max-limit for emailing out - but its almost the same exact map.
Then we look at Labarga, the lone liberal remaining on the court, and the swing is almost exactly the same. Despite still being a more left-moderate judge, Labarga was rewarded by conservatives and punished by liberals.
All about the vibes.
In addition to these swings, how Polston and Canady did compared to the new conservatives also reveals some lingering sentiment from past retention cycles. Canady, Polston, Couriel, and Grosshans are all conservatives - with little reason for voters to split tickets on. However, the new Justices would notably outperform the conservative “Incumbents” in the rural communities and did worse in the urban centers.
What is the story here? My firm theory is that Canady and Polston still have lingering opposition in communities that used to be much more prone to rejecting retention due to the court’s overall liberal reputation pre-2018. Canady and Polston got friendly fire in their old retention elections, and it is likely some of the more partisan voters remembered rejecting the two before and a small batch continued to do so. Meanwhile, more left-leaning voters remember voting to retain the two and stuck with them while giving less good will to the new names.
All of this difference DESPITE these justices all being the same in terms of ideology. A VAST VAST VAST majority of voters are doing little/nothing to distinguish one Justice from the other. This is truly just going on vibes and muscle memory of the past.
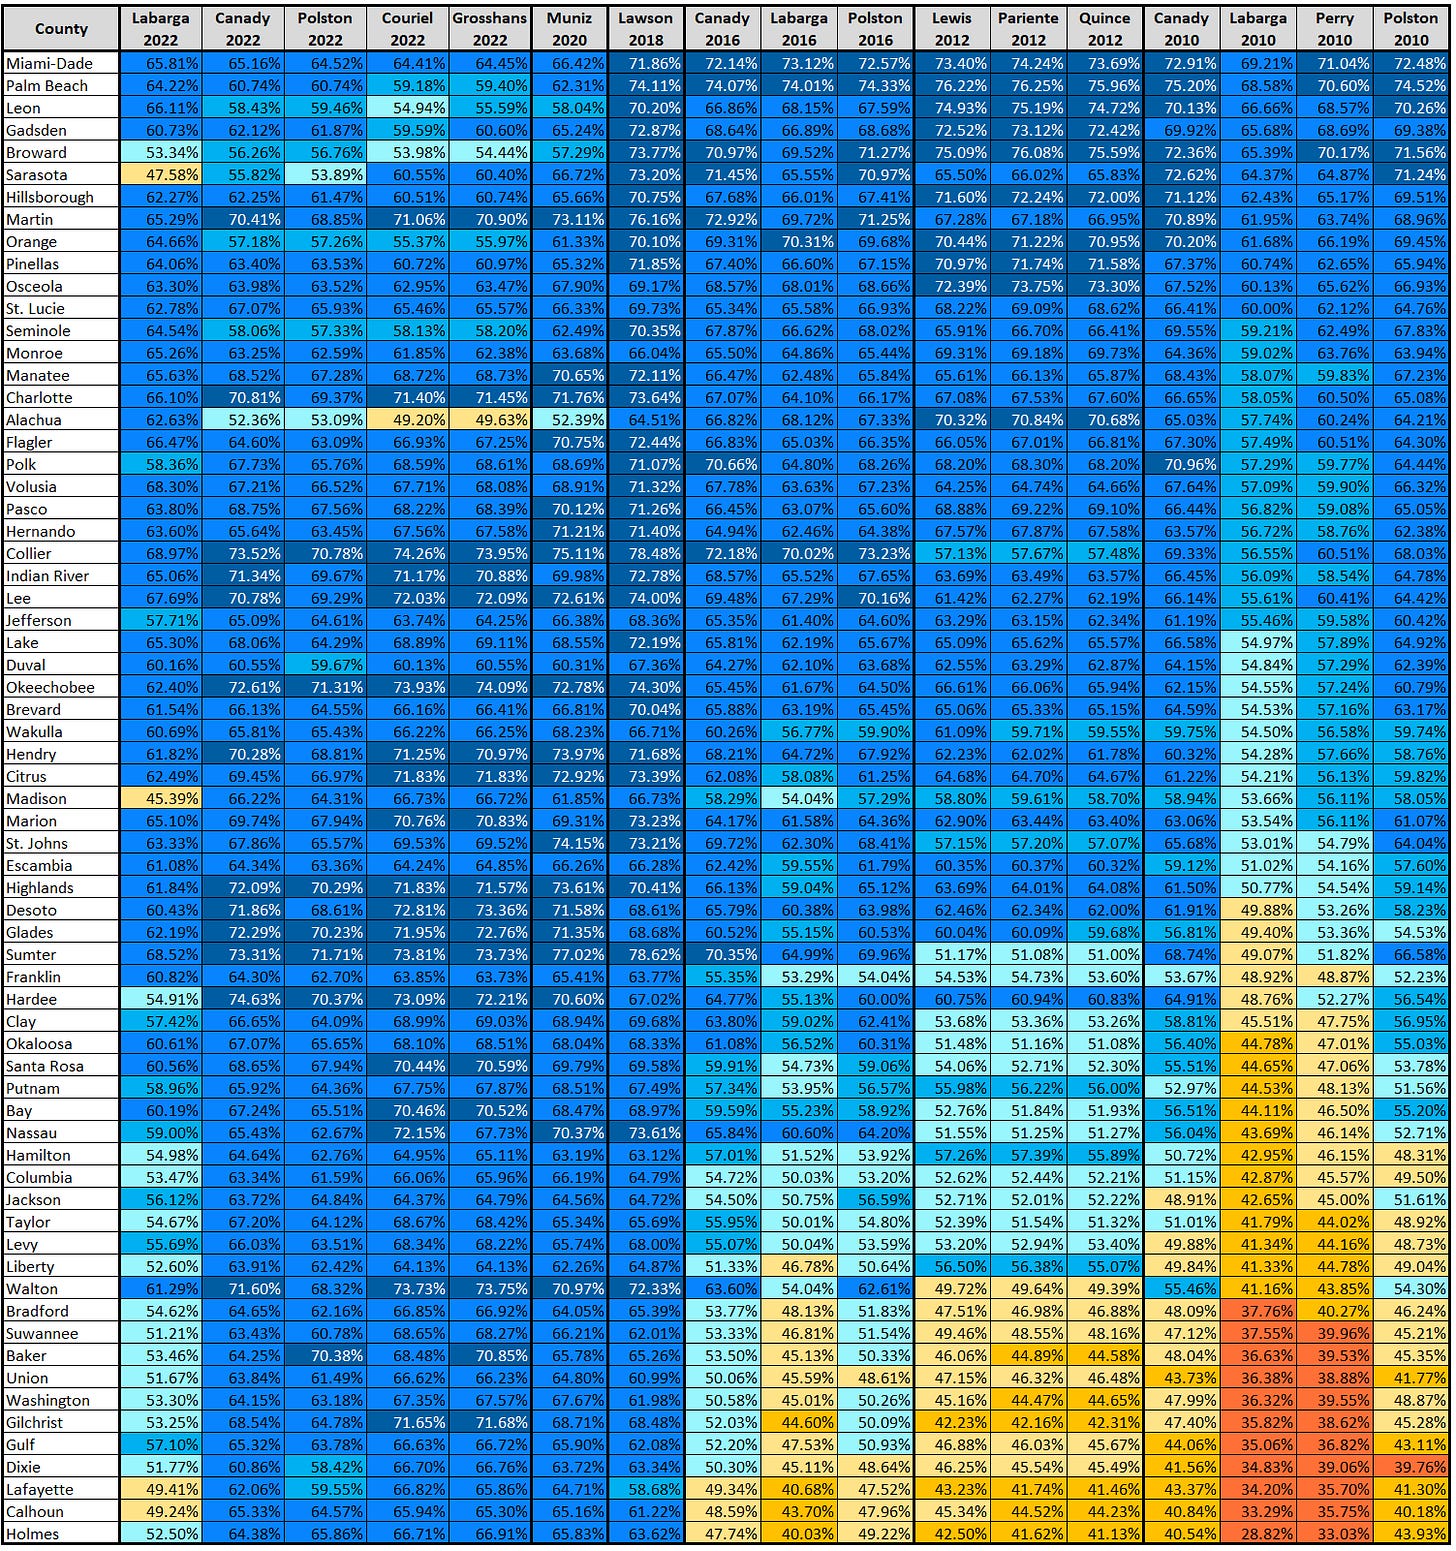
Below is a table of retention votes by county - with 2022 on the left and and moving right into the 2010 votes.
You can see the large batch of rural counties that used to vote against retention but have now moved more into the fold. Meanwhile, some Dem-aligned counties have become less pro-retain.
Effect of Slates on the Vote
As you looked through these maps, some areas may stand out as outliers. Why did Labarga do poorly with Broward’s black population but not in other counties? Why did Sarasota seem to swing toward rejection?
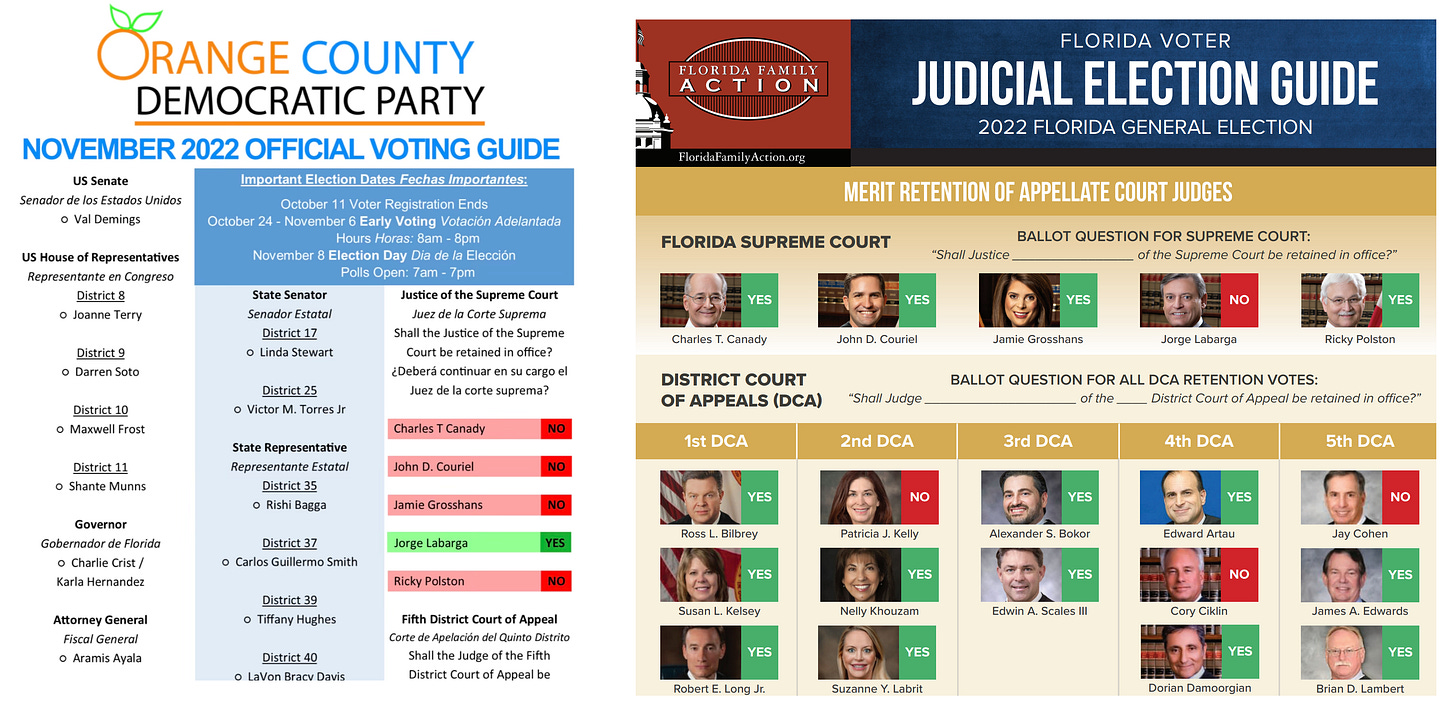
The short answer is that with no major statewide campaigns happening for these seats, the votes can be heavily moved by slate cards. Super voters will often get slate cards from state parties, county parties, or 3rd party groups. These mainly aim to tie in non-partisan races (like city council or ballot measures) with a partisan slate. Democrats want their voters to know that City Council candidate A is a registered Democrat with their support - and vice versa for the GOP.
We have seen slates be used with retention elections as well. Many GOP slate cards in 2012 called for rejecting retention for the justices, while Democrats pushed retention. This cycle, we saw more slate cards advocating splitting tickets: with the conservative slates advocating against Labarga but for everyone else, and Democratic slates saying to only keep Labarga. See just two examples.
These dueling slates can cause notable outlier pockets. I cannot confirm what happened in central Broward, but there very well could have been local slate cards that just simplified things with REJECT ALL, and that dragged down Labarga there. Likewise in Sarasota, all justices lost Dem-level support to some degree, but the local conservative clubs also pushed heavily against Labarga, causing him to lose the entire county. Sarasota was also a county where the new conservatives had a sizable overperformance from Canady and Polston.
Hey if you are reading this and have more info on the Sarasota campaigns - leave a comment.
I believe the trends from 2022 will continue into next year. Ricky Polston has announced he is stepping down, meaning a new DeSantis appointee will be up for retention in 2024. I expect the vibes on display here to continue. Don’t worry, I will write about it.


