Issue #85: The 2022 Florida Races by Congressional District
How many districts did DeSantis and Rubio win
Last month, Ron DeSantis and Marco Rubio won landslide re-elections for Governor and US Senator. After getting the last of the precinct data I needed, I can now present how Rubio’s 16% win and DeSantis’ 19% win break down by Congressional district. In addition, I have the breakdowns for some of the other redistricting proposals that did not get enacted.
Redistricting Refresher
Since its been several months, I think a quick refresher on Florida redistricting is warranted. If you dig back into this substack’s archives, you will find no shortage of week-by-week coverage of the redistricting process; so I invite you to flip through the archives if you want to know details.
From late 2021 to early 2022, the Florida legislature seemed eager to release maps that would not warrant a lawsuit. While the House and Senate had some disagreements - most notably around Orlando - both chambers largely aimed to retain minority-access districts and not push their luck on blatantly partisan moves. The Florida Senate passed this proposal with only a few dissenting votes - this map being largely viewed as the best Democrats could hope for.
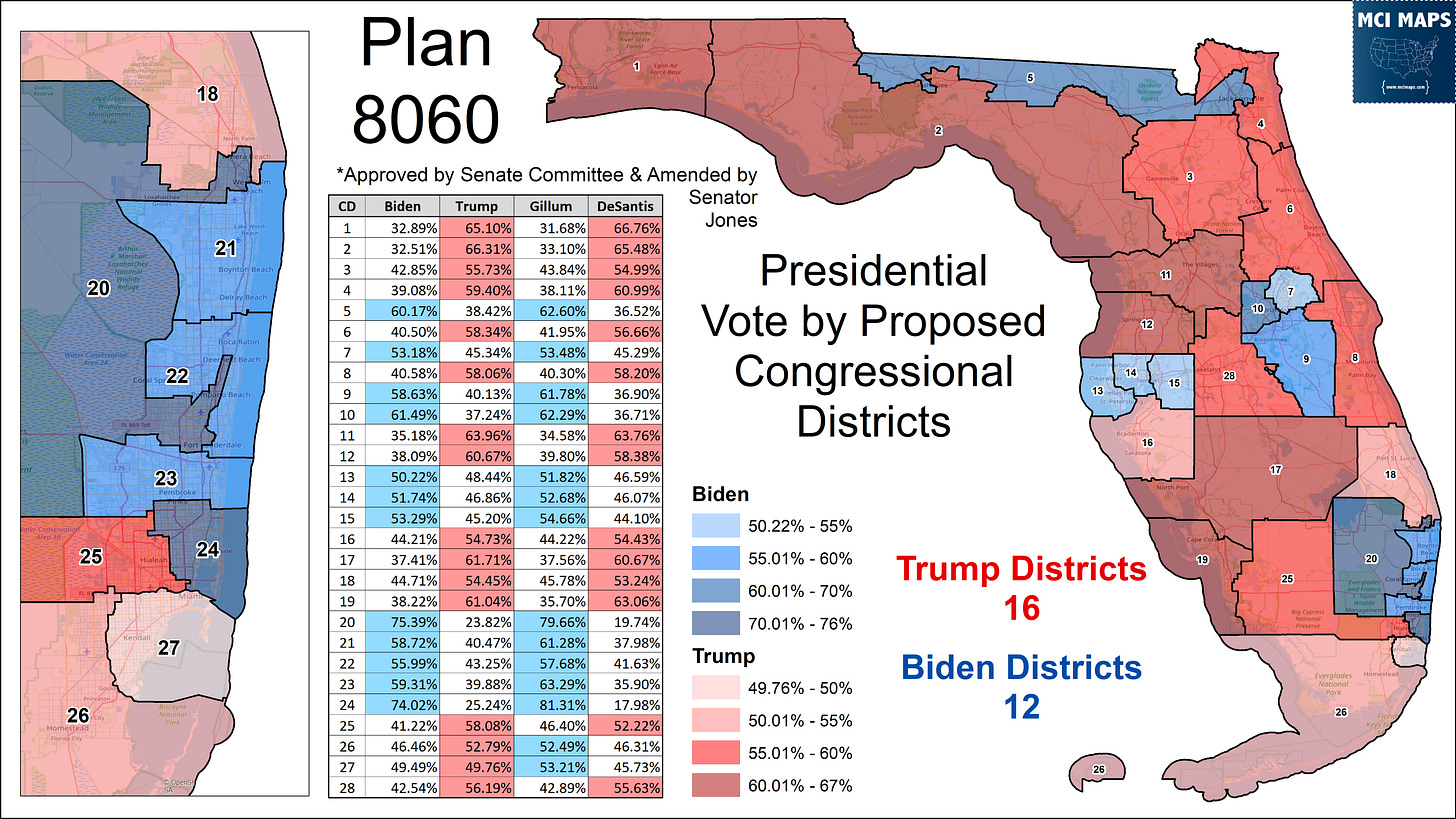
The Senate proposal had 16 Trump districts to Biden’s 12. However, the map also was 14 Gillum, 14 DeSantis (with 26 and 27 flipping) from their 2018 contest. The map gave both Democrats and Republicans a chance to win all 3 Tampa Bay districts, kept two swing seats in Miami-Dade, retained the black-access North Florida district, and didn’t aim to gerrymander the Dem-leaning 7th in Orlando.
The debate between the house and senate was initially over the Orlando and Tampa region. House maps notably did gerrymander the 7th in Orlando, but left most of the other districts alone. However, when DeSantis got involved in late January to insist on a more gerrymandered map (under the guise of destroying minority representation), an attempt to compromise with the Governor began. Eventually the legislature passed this proposal.
The plan above, which passed both chambers of the legislature, created a black-access seat just in Duval County. It also gerrymandered the 7th in Orlando created two dem-leaning seats in Tampa with one GOP-leaning seat. Tampa would allow both parties to win all three of its seats (13, 14, 15) while the 7th was only modestly red. This plan was more GOP-friendly, but not as extreme as the final map.
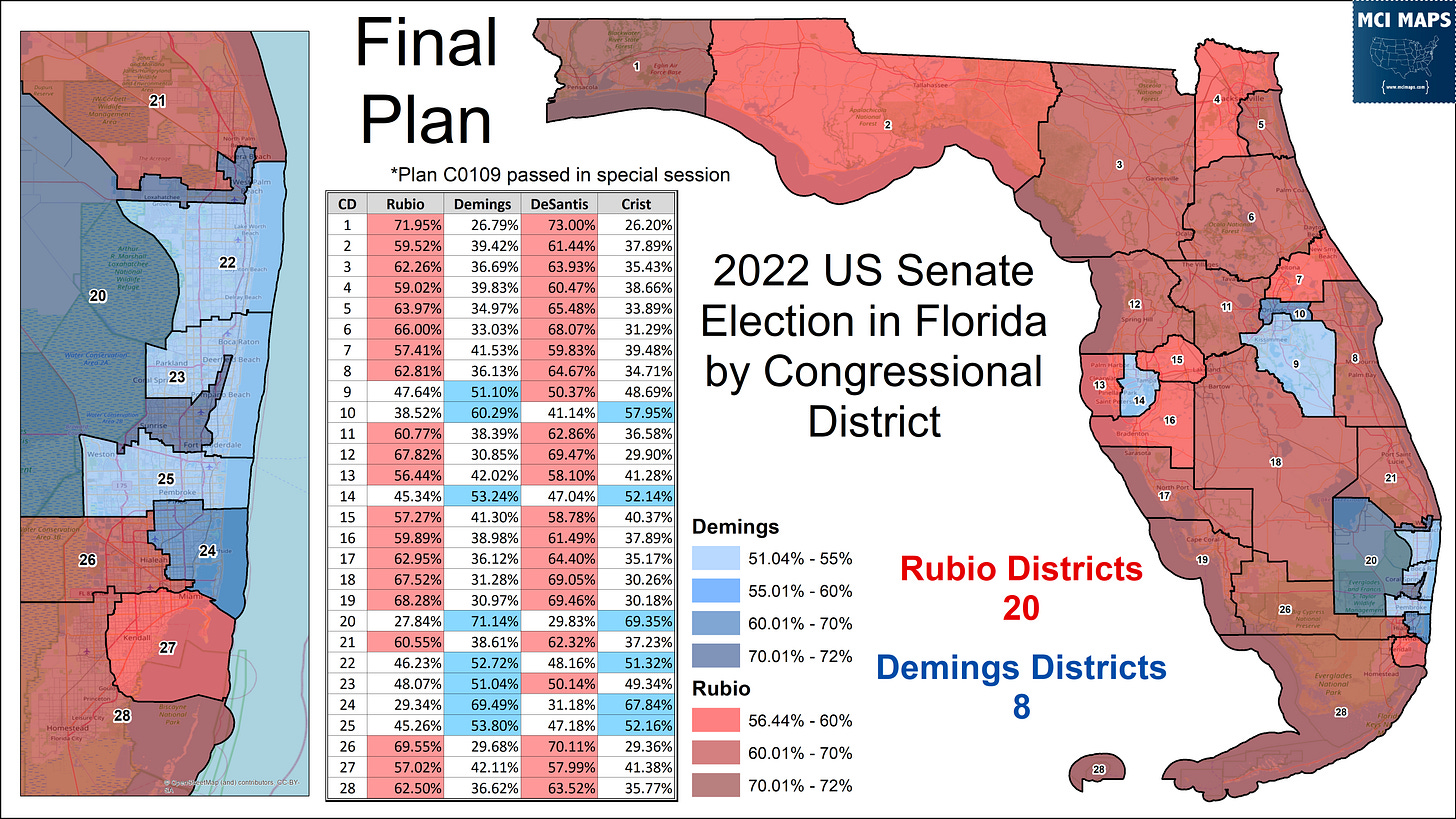
After DeSantis vetoed the map, the legislature caved to his proposal. The plan gave Trump 20 districts to Biden’s 8. No black opportunity existed in North Florida under this proposal - an issue currently the subject of a lawsuit working its way through the courts.
Another deviation from the vetoed plan is a packing of Democrats into CD14 in Tampa, making it less likely it would flip red, but also gerrymandering the Crist-held 13th to make it much more GOP friendly. In Orlando, the 7th was also moved much more to the right than the vetoed proposal, likely putting it in GOP columns for the next several years.
So before the 2022 elections even happened, the final map was projected to give Republicans FOUR pickups. Democrats were being gerrymandered out of 5, 7, and 13 - while the new seat drawn for Florida would also be red.
I delved into the final map in a very large deep dive article
Click the link above for that deep-dive, including past election breakdowns.
The 2022 Election Results by District
So heading into the midterms, Florida was dealing with a very gerrymandered proposal. I broke down the Governor and Senator races by Congressional district to see how these districts performed. Of course, it would be nice if we had a Democratic WIN to see how many seats they won (Obama only won 12 districts in his 2008 Florida win - for example). This time, though, we only have big GOP wins to go with.
First lets look at US Senate race. Rubio won by 16% over Val Demings and won 20 districts, the same as Trump. Rubio racked up massive margins in the Trump districts, and did keep margins very close in several blue-leaning seats. Districts 9 and 23 were under 5% margins.
The massive GOP swings in Tampa, which saw Pinellas and Hillsborough flip, almost brought the 14th into contention. However, its status as a democratic vote-sink kept it blue. Republicans flipping Palm and Osceola also kept the 22, 23, and 9th all lighter blue than they should be.
On the Governor front, DeSantis’ 19% win allowed him to flip the two most marginal districts - 9 and 23.
I delved into the DeSantis win in CD23 in this article. DeSantis also manages to get within 5% of 14 and 25.
Here is a Google Spreadsheet with the Raw Data
As a result of this map, two Democratic Congresspeople - Darren Soto and Jared Moskowitz - will sit in DeSantis-Demings seats. They both over-performed Charlie Crist and Val Demings to secure their seats. However, they were not the only over-performers. Below is a table of how Congressional Democratic candidates compared to Demings and Crist.
Note 5, 6, and 18 didn’t have Democratic opponents. As the table shows, most districts saw the Democratic candidate for Congress overperform Crist; while it was about half and half regarding Demings. The biggest over-performer was CD1’s Rebekah Jones, though it had nothing to do with her and everything to do with Matt Gaetz’ long-standing legal troubles. CD9’s Darren Soto and CD14’s Kathy Castor were the biggest over-performing incumbents. In the gerrymandered version of Crist’s CD13, MAGA Republican Anna Paulina Luna way under-performed the GOP base.
There are several districts I desire to dig more into. I especially want to dig deeper into CD13 and Tampa Bay. So expect more breakdowns from me on specific districts in the coming weeks.
How the Other Plans Would Have Broken Down
I talked about two of the failed redistricting plans in my overview - so lets look at his they would have performed in the 2022 elections. Both of these plans have similar totals going to each candidate - with the biggest difference being about margins and future opportunities.
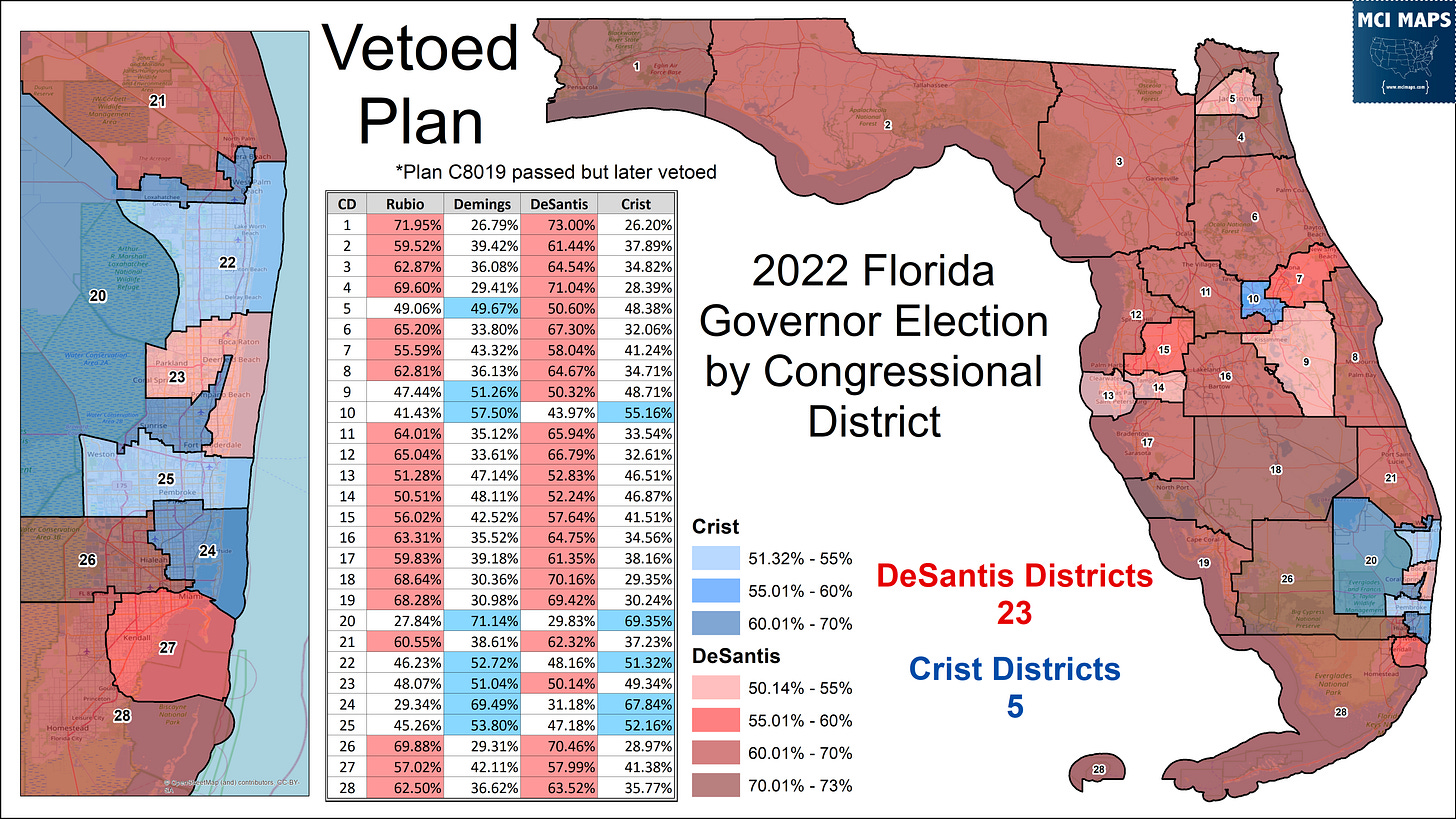
First is the plan DeSantis vetoed - the one that aimed to keep a black-access seat in Duval. That plan would have also given 20 districts to Rubio. It trades Demings winning the 5th for Rubio winning the 14th.
Remember, the vetoed plan had a Tampa Bay layout that allowed both parties to compete for several districts. With such a landslide, it should be no real shock Rubio would take all Tampa Bay seats. However, the black-access Duval seat would still be much more Dem-leaning than the state as a whole. It would narrowly back Demings but then back DeSantis - both narrow races.
Speaking of the Governor’s race, here is the breakdown for DeSantis vs Crist by district. Here, DeSantis won 23 seats to Crist’s 5! The Demings-DeSantis seats are 5 in Jacksonville, the Hispanic-majority 9th, and the 23rd.
So how does DeSantis win won additional seat here than he does in the actual map? He is winning all Tampa seats thanks to the lack of a vote-sink there. While he is also taking CD5 in both proposals, the difference here is its a very narrow win vs a landslide in the actual map.
Finally, lets look at the breakdown for the plan the State Senate initially passed. Like previous plans, Marco Rubio wins 20 seats to Demings’ 8. While all of Tampa Bay is red, the North Florida 5th, which would be a black-performing seat here, remains democratic. Also note the 7th is much closer here.
On the Governor front, DeSantis takes the Orlando and Broward districts like he does in previous plans. However, he still loses the 5th in North Florida by 5 points. The 9th is also razor thin.
The 22-6 breakdown is the same as the actual congressional map, but with several seats much closer to flipping back to Democrats.
So Did the Gerrymander Matter
Many people, in both good and bad faith, will look at the district totals and say “well DeSantis won 22 in many plans, so did they gerrymander matter?” The answer to this is yes - because the margins in the districts matter.
The massive landslides of 2022 meant that any balanced and fair plan would see the landslide winner taking a vast majority of seats. A 22-6 breakdown makes sense if you are winning by 20% amid a massive collapse in your opposition’s turnout.
Had a map like the Senate’s or the Vetoed plan been in effect, Republicans likely would have still flipped the 13th and 7th. The 14th very likely could have been a shocking flip as well. Democratic hopes to take the 15th or 27th would also have gone up in smoke. However! The big question is what happens after 2022.
With the map we have now, and assuming Democrats do NOT have a repeat of the turnout issue they had this cycle - the question is, what districts can they try to take back? Forget about the 2022 landslides. If we look back at the 2020 and previous elections, it makes it pretty clear that right now the only semi-competitive seats would be….
CD15 in Tampa - Which was narrow Trump and Gillum
CD27 in Dade - A perpetually close district
CD28 in Dade - The former 26th, it is more GOP-friendly than 27
Now, Democrats have so much rebuilding to do that these districts may not be on the cards anyway. But on paper they can be. Meanwhile, what if the Vetoed plan was our map. What chances would Democrats have then?
CD5 - If Democrats lost it, though they could have held it, it would be a good pickup chance in 2024, being a solidly Biden Seat
CD7 - In this plan its still a very narrow seat if turnout is better. If it flipped this year it could be a top pickup opportunity.
CD13 & CD14 - Both narrowly democratic leaning that could have flipped red in 2022, but would be top pickup pushes in 2024
CD 15, 27, 28 (or 26 depending on numbering) - same story as current map
And what if the State Senate’s plan was passed?
CD5 would be Democratic solid
CD7 would have been close but could have been held, but would be prime 2024 target if it did flip to the GOP
CD 13, 14, & 15 - All three would be prime Democratic targets in 2024, having all voted for Biden
27 and 28 (or 26 depending on numbering) in Dade - Would always been on paper competitive
Here is a visual breakdown of all that
So at the end of the day, the other maps I have discussed would give Democrats chances to win back seats that they got swept out of in a bad cycle. The map we have, however, never had many good Democratic opportunities. As long as this is the map, then 15, 27, and 28 remain the only major opportunities for Dems. This means the map is not responsive to trends.
Republicans, for their side, will likely be looking at CD9 and CD23 in the 2024 elections. However, this current batch of results truly represents the lowest Democratic support levels in the modern era. It also saw down-ballot dems improve on the top of the ticket. Now I’m not saying Democrats can’t fall more! However, there is also a very real chance that a Presidential year naturally inflates Democratic turnout to some modest degree.
Like I said, much more district-specific work must be done. I intend to do a much larger breakdown of these results in the coming weeks, and will likely have individual substack posts dedicated to key districts. One idea I have already is to look at CD13 and see if Luna could have won a fairer version of the 13th, even with DeSantis-Rubio doing well in Pinellas. I especially want to do dig deeper into Tampa Bay and Jacksonville.
So expect more in the coming weeks as more data becomes available.


