


Issue #234: Looking at 2024 Partisan Turnout in Florida
The complicated case of turnout vs vote cast

What’s this? Do your eyes deceive you? Is Matthew finally doing an article about Florida again? Yes after a month of articles dedicates to elections in other countries, I am back to talk about Florida. Don’t get me wrong, I still have a good deal to say and write about other elections in the world, but I also have been slowly and surely working on more Florida-centric articles.
I am finally able to send out this latest piece, a long-awaited look at turnout in Florida in 2024. This article will give some key turnout information from the 2024 election; answering part of the explainer on why Florida swung 10 points to the right in the election. I still have several additional Florida articles to write, several already in the works.
This is also just the FIRST article on the turnout dynamics from 2024. Here I will look over partisan turnout broadly, with a quick look at dynamics by race. However, expect a more detailed look at racial turnout in another article to come.
With no delay, lets dive into partisan turnout in Florida.
What Happened in the 2024 Election
I have already written about Florida’s 2024 results a few times. You can go to this tag for the list of all Florida 2024-centric posts. For a quick recap, however, Florida backed Donald Trump by 13 points last November.
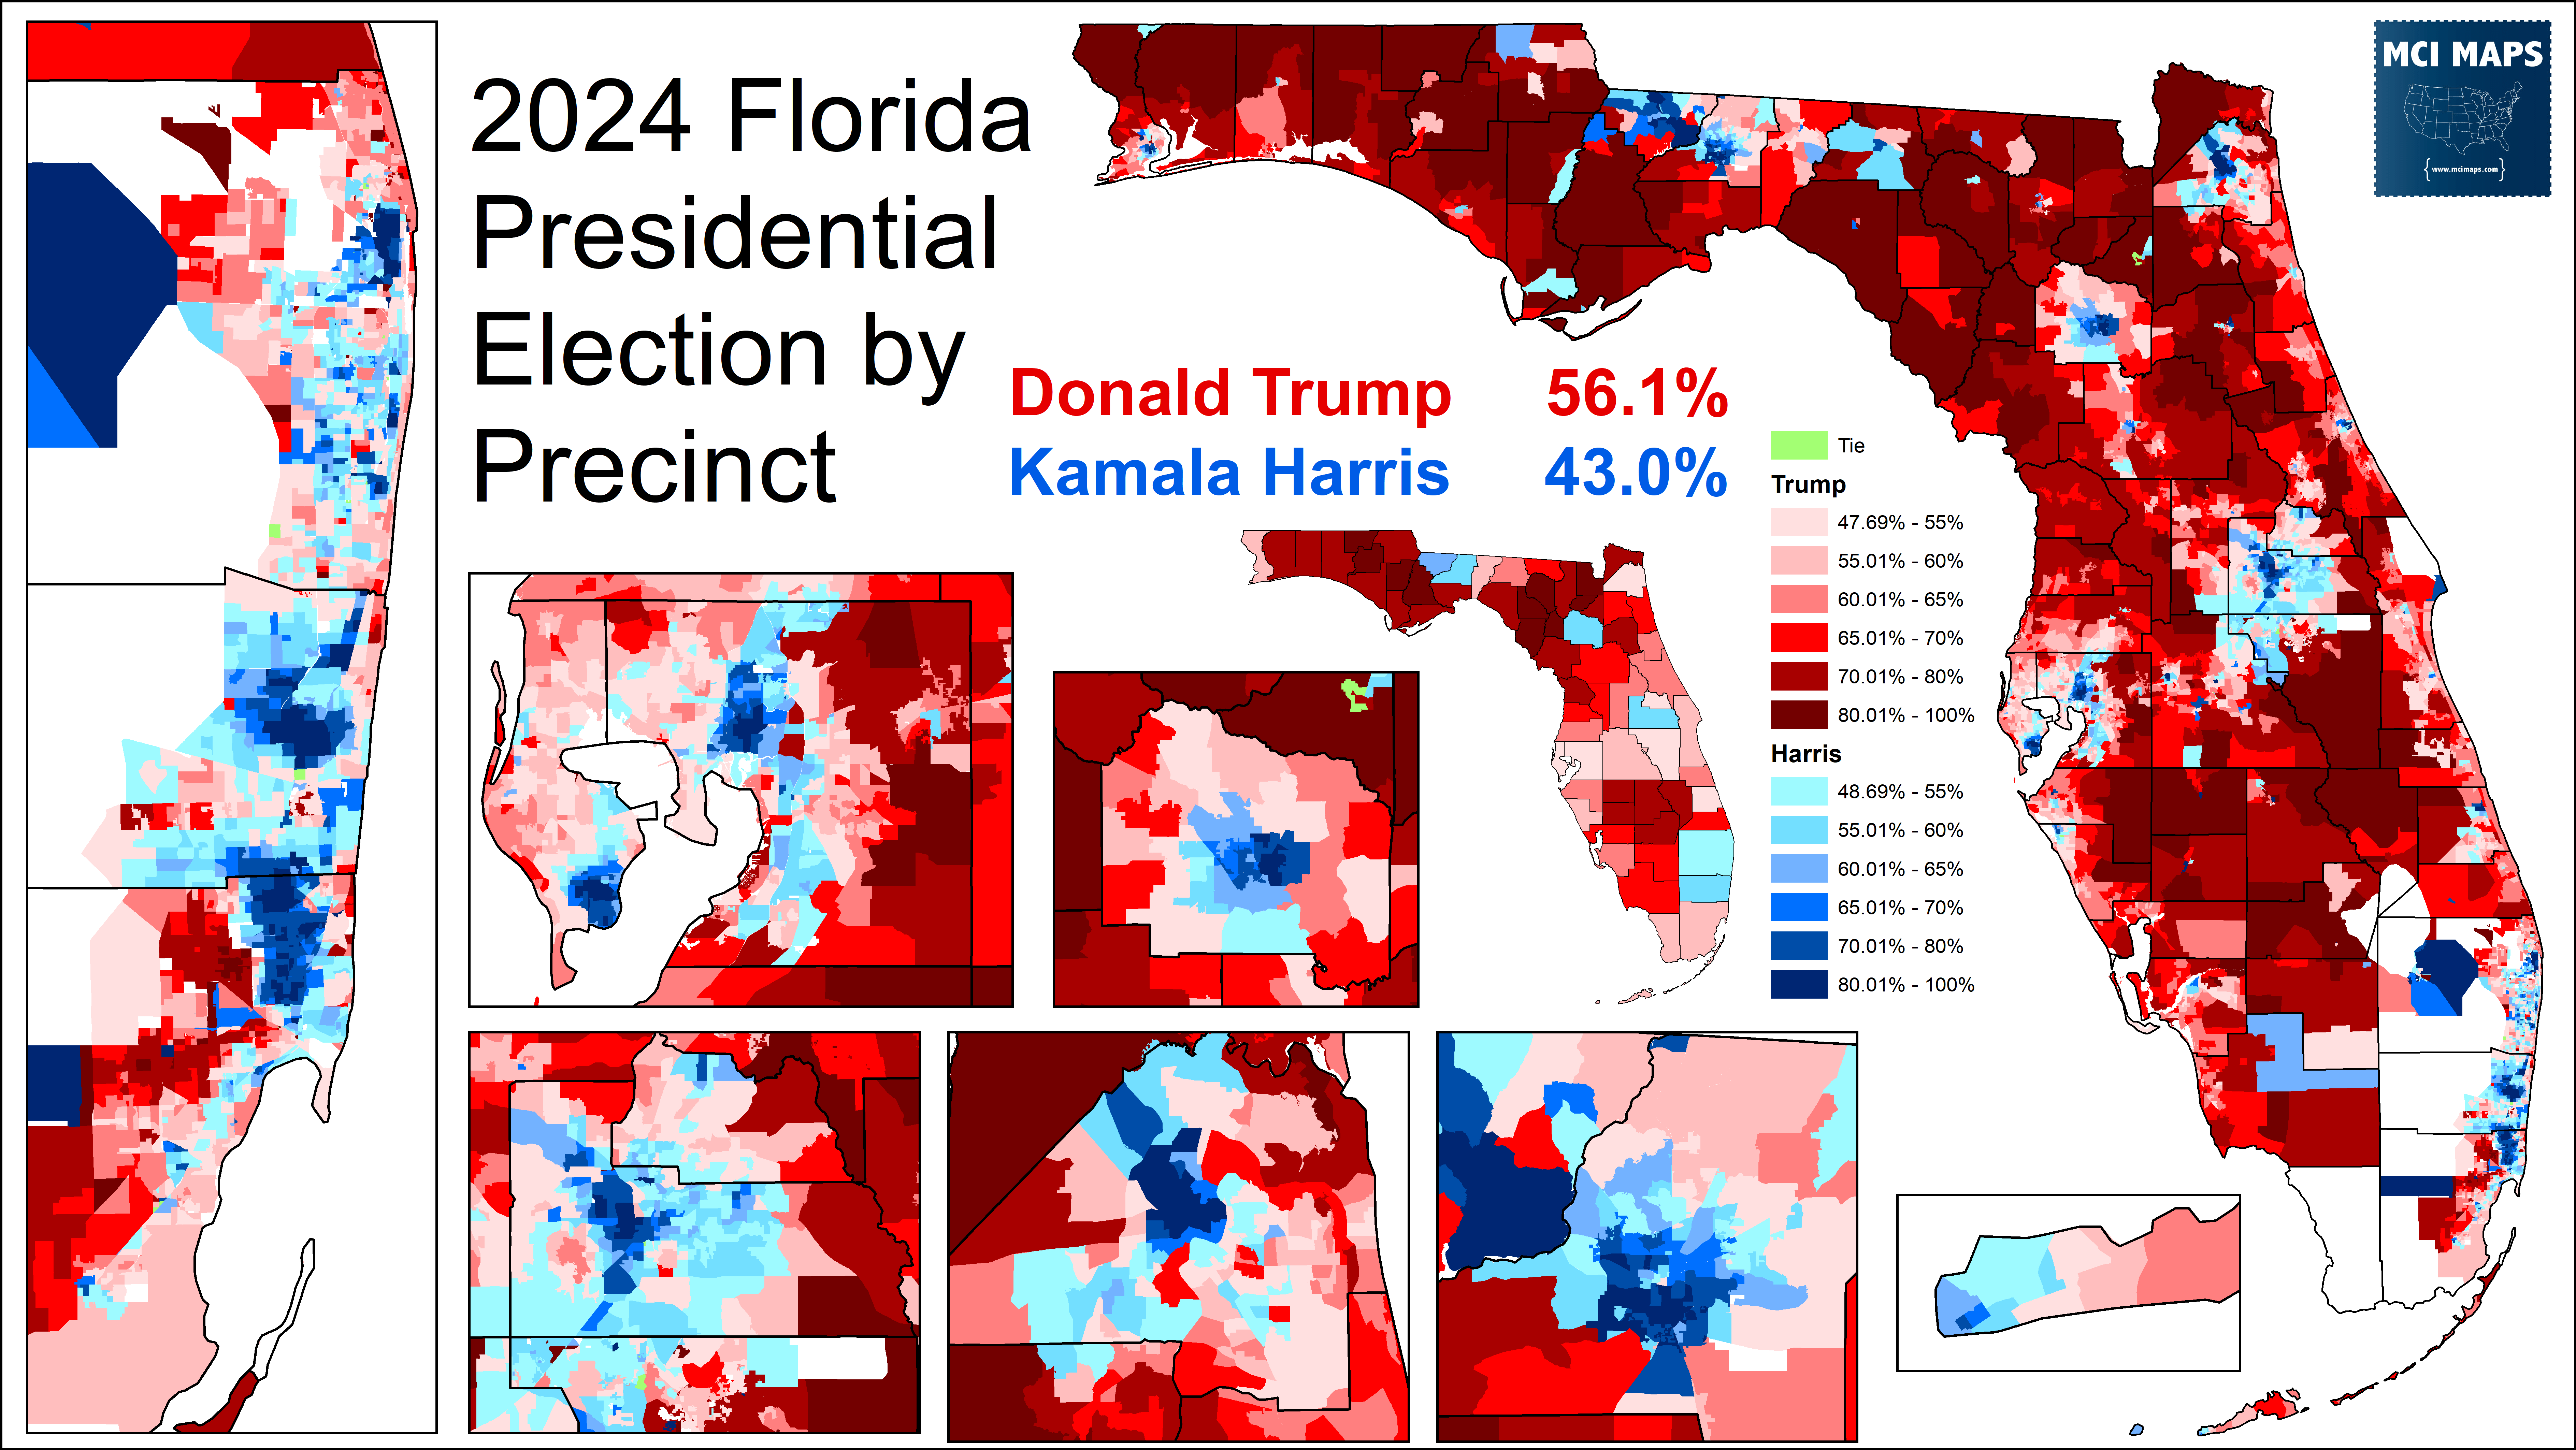
Florida swung just under 10 points to the right from 2020. Every county moved further to the GOP, with several flipping from Biden to Trump. The 13 point margin is the largest in Florida since the 1980s; permanently breaking Florida’s perception as a battleground state. While many experts have long pointed to Florida’s decline as a swing state, myself saying as much to the New York Times in 2020, this result is the exclamation mark on the sentiment.
The massive size of the swing from 2020 is attributed to several factors. Part of this is, yes, Biden and Clinton voters going for Trump. However, another big issue, the focus of this article, is that the electorate today has far more registered Republicans than in previous years. Back in the 2020 election, registered Republicans made up 40% of the vote, compared with 38% for Democrats. This time around, Republicans made up 45% of the vote, compared with 30% of Democrats.
As a result of that fact, many have speculated that Democrats did not turn out to vote; that millions of Democrats must have stayed home. However, the story of turnout is a bit more complicated than that. Lets get into the weeds.
Better Turnout than Expected
Turnout was strong in Florida, despite the state not being considered a battleground and seeing virtually zero investment from outside groups. In fact, final turnout was 79%, the highest in in the 21st century.
Turnout by precinct can be seen below, with green being areas with higher than the state total, and violet under. There you can see plenty of patterns; namely lower turnout in Democrat-heavy core areas.

If you know the basics of where Democratic hotspots are in Florida, the location of the violet likely telling you “Jesus turnout must have been much worse for Democrats than Republicans.” There would be good reason to worry about that; especially after the last election in Florida.
If we look back at the 2022 midterm, a big reason for Florida’s big Republican landslides; which saw Ron DeSantis and Marco Rubio win re-election by almost 20 points, was due to turnout. I wrote about this here, but the big problem was that Republican turnout was 67% compared with Democrats at 52%. This 15 point gap was record-high and led to a far more Republican electorate than ever before.
This time, however, Democrats managed to close the turnout gap by quiet a bit. Democrats achieved 78.8% turnout to the Republican’s 85.5%. This 6.7% gap is much more in line with the turnout gap in 2012, 2016, and 2020. Here you can really see how much the 2022 midterm stands out.

So Republicans had better turnout, but it was far more in line with previous Presidential cycles. Below you can see the turnout gap within each county. Almost all counties saw a Republican turnout lead. Yep Miami-Dade was really bad, and yep I’m gonna have a whole article on it down the line.

If turnout was in line with previous Presidential years, then why was the electorate so much more Republican than previous years?
That is because voter registration in Florida is far more Republican than previous years.
Registration Problems
Right before the 2024 election, I wrote about the current state of voter registration in Florida. Back in 2022, Republicans finally took the lead in voter registration, and over the last two years, that lead only expanded. When registration cut off in October of 2024, Republicans had an 7.7% advantage.

The story here is multi-layered, and I go into it in MUCH more detail in the October article, so check that out below for more details on raw numbers and trends within counties. A key issue here is that while Republicans and Independents have seen their raw rolls go up, Democrats have seen their raw numbers fall. I delve into reasons and historic examples in the October piece.

A big issue I go into in that piece is the cost of voter registration being so high, leading to an under-funded Democratic Party, which now gets no outside help, being unable to engage in broad statewide voter drives. As a result, as people fall of the rolls due to moving, deaths, or inactivist, they are not replaced, leaving a large pool of unregistered voters.
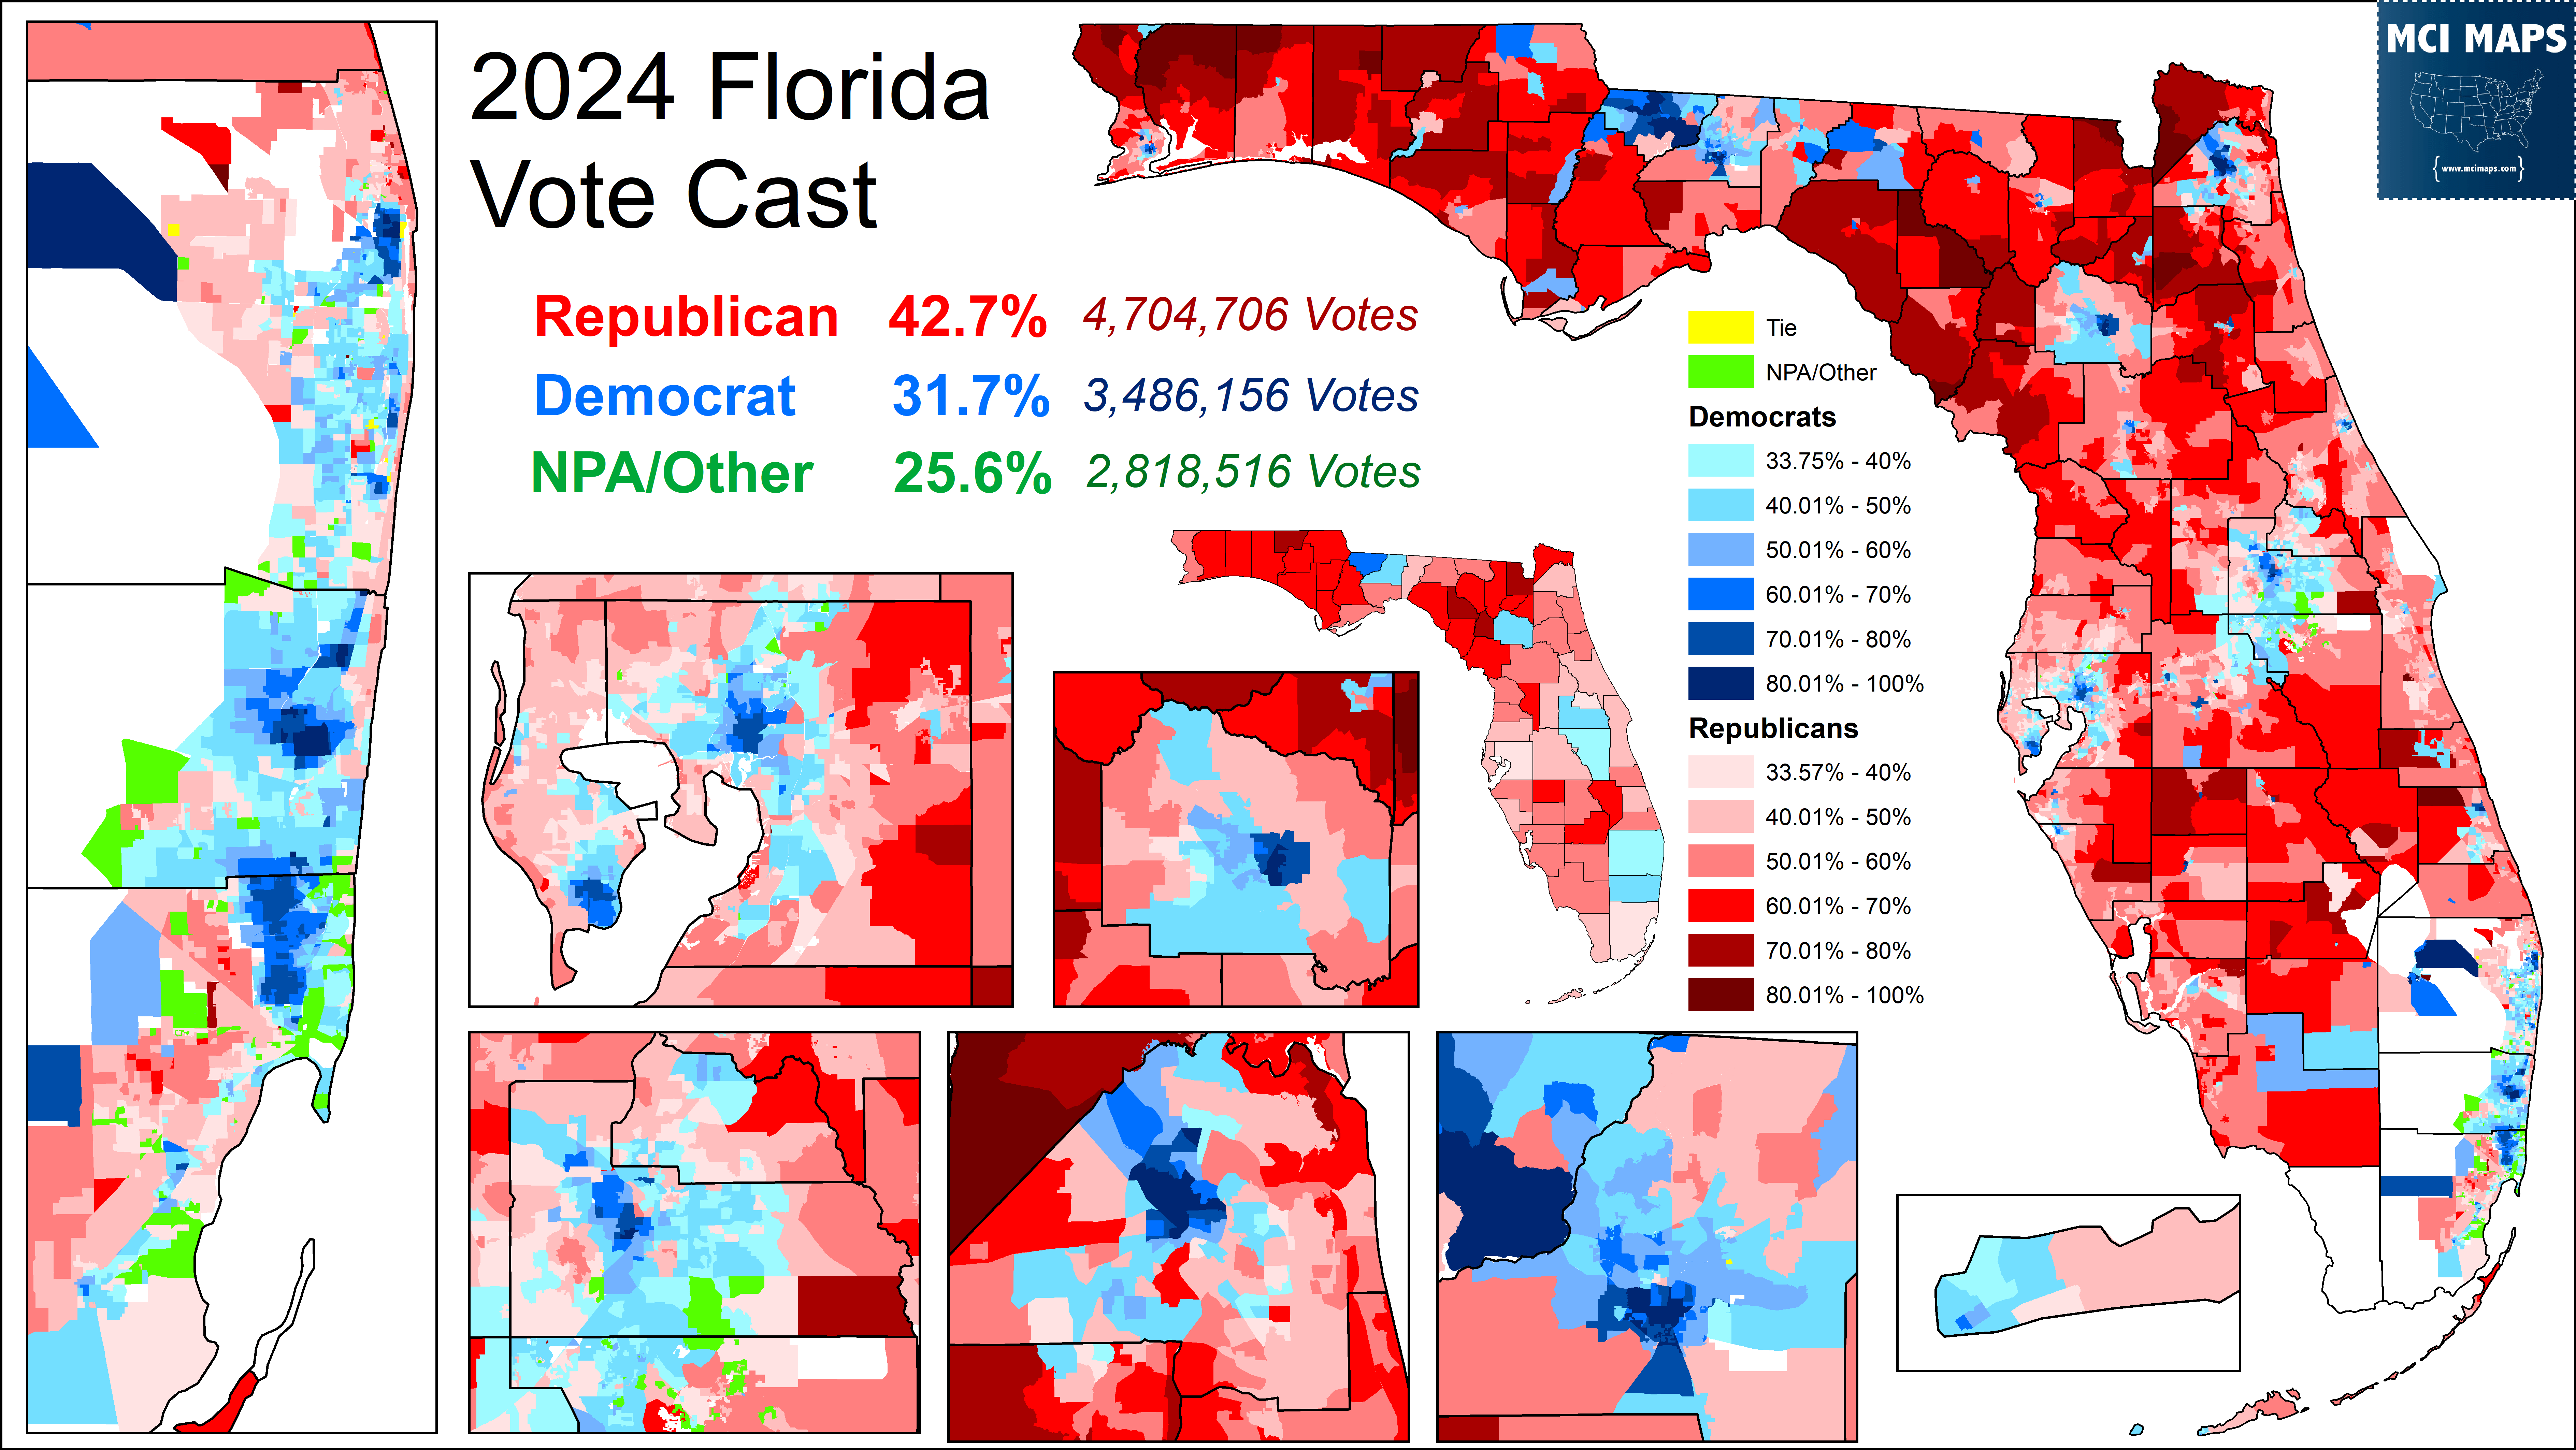
As a result of this registration gap, the final vote cast was far more Republican than previous years. Back in 2020, Democrats had a 1% registration lead while Republicans had a 2% vote cast lead. This time, however, the 7% registration lead translated into an 11% vote cast lead. VERY different from four years ago.
Here you can see a full table showing registration, turnout, and votes cast from 2012 to the 2024. Democrats lost the registration lead in 2020; though Republicans maintained a lead in votes cast sense 2014. The lopsided turnout issue in 2022 stands out clearly there.

The table in the bottom right shows the margin in registration and vote cast over the years. I plotted both data point on the line graph below.
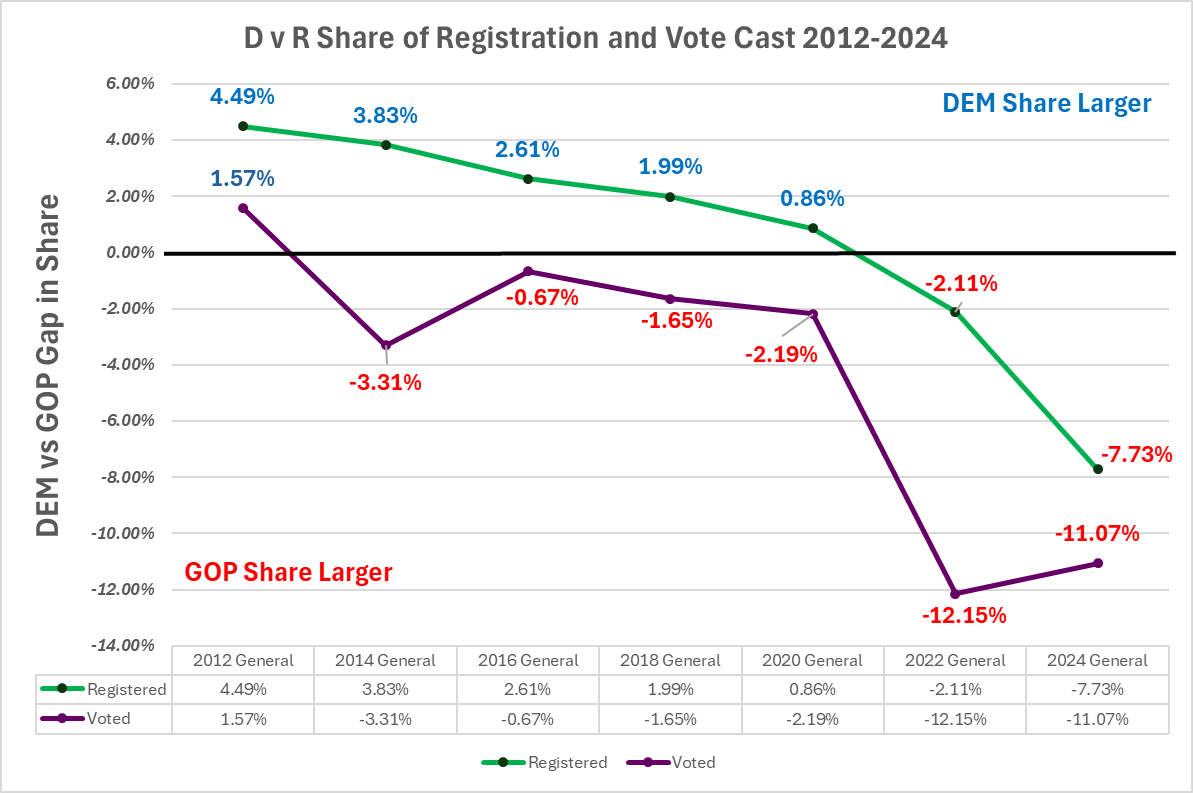
Despite a much improved turnout dynamic, thanks to the massive shift in voter registration, it dragged down the share of votes cast. The turnout improvement is, however, seen in the fact that the voted margin gets less Republican from 2022; despite the registration margin getting much redder. That purple line tilting up is a testament to the turnout drive that did take place. However, with such a massive registration gap, the vote cast was always destined to be solidly red.
Demographic Turnout Preview
As mentioned at the start, I plan to do a more detailed look at turnout by race in my next Florida turnout piece. However, I have some key data points to highlight right now. Below you can see turnout broken down by race and party. The table shows the DvR share of registration and vote cast by ethnic group.

As the table highlights, Florida’s Hispanic population has more NPA voters than any specific party; with Ds and Rs close to the same share. However, thanks to a solid 9% turnout lead with Hispanics, Republicans had a modest lead in vote cast. This fact will be important when analyzing voting trends with Hispanic voters. Meanwhile, turnout among white voters was nearly even, but of course white voters in Florida lean heavily to the GOP.
Among Black voters, however, Democratic turnout surpassed Republicans. The big issue for Democrats, however, was that Black turnout lagged White, Hispanic, and other racial group turnouts. The 68% turnout was down a bit from the 70% it was in 2020. White turnout, meanwhile, went up 3 points.
When we break down turnout by race and age, we get a much clearer picture of why Black turnout lagged. While older Black voters had much stronger turnout, keeping pace with white voters and surpassing Hispanics, its a very different story among young voters.
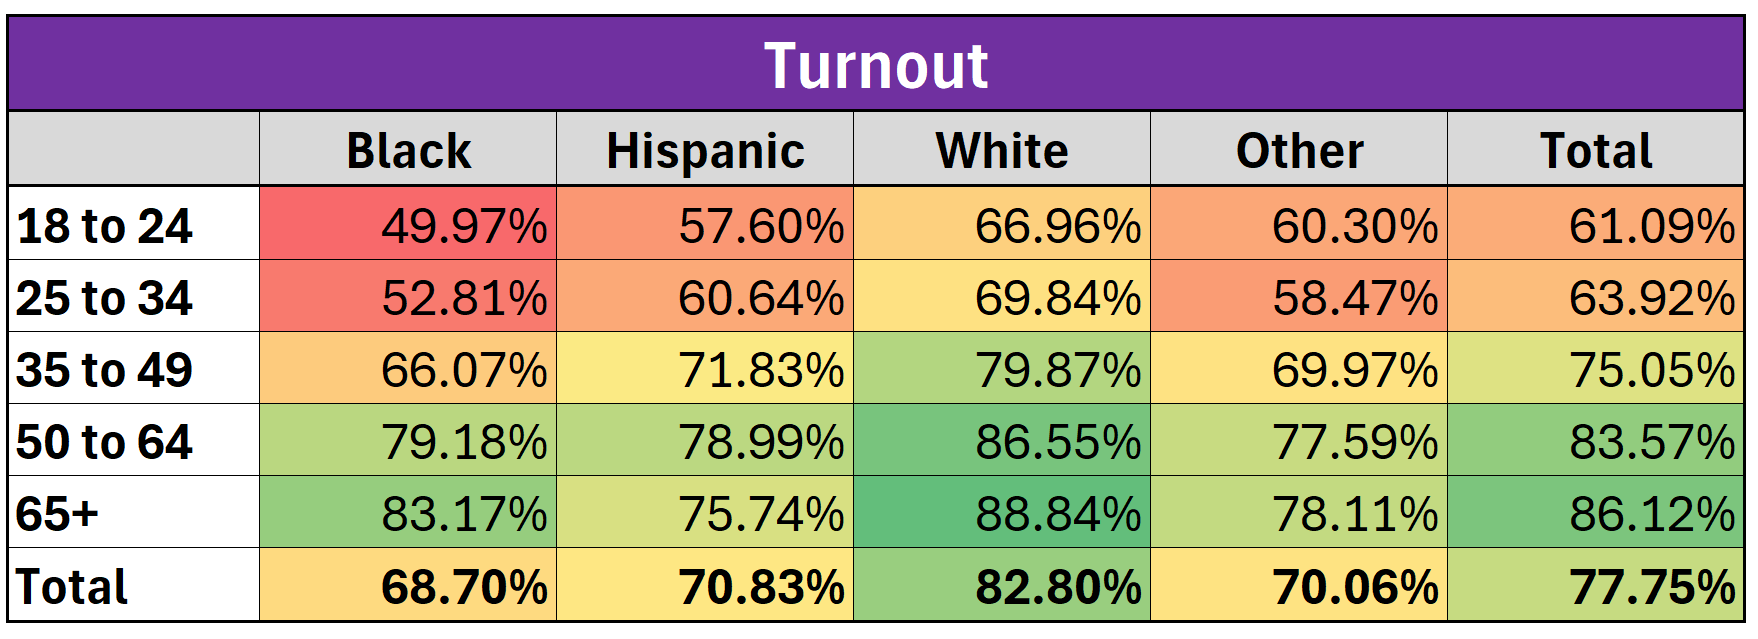
Black voters 18-24 had the weakest turnout of any major demographic group in Florida. For Florida Democrats, this is a MAJOR problem that needs to be improved for the future.
I’ll be diving more into turnout race, age, and gender in my next turnout article.