Issue #14: Broward Redistricting & Racial Representation
New rules will hopefully lead a more diverse county commission
Broward County, FL is the second largest county in the state. It is an overwhelmingly Democratic county; with a diverse mix of racial and cultural groups. It also has one of the worst county commission maps in the state.
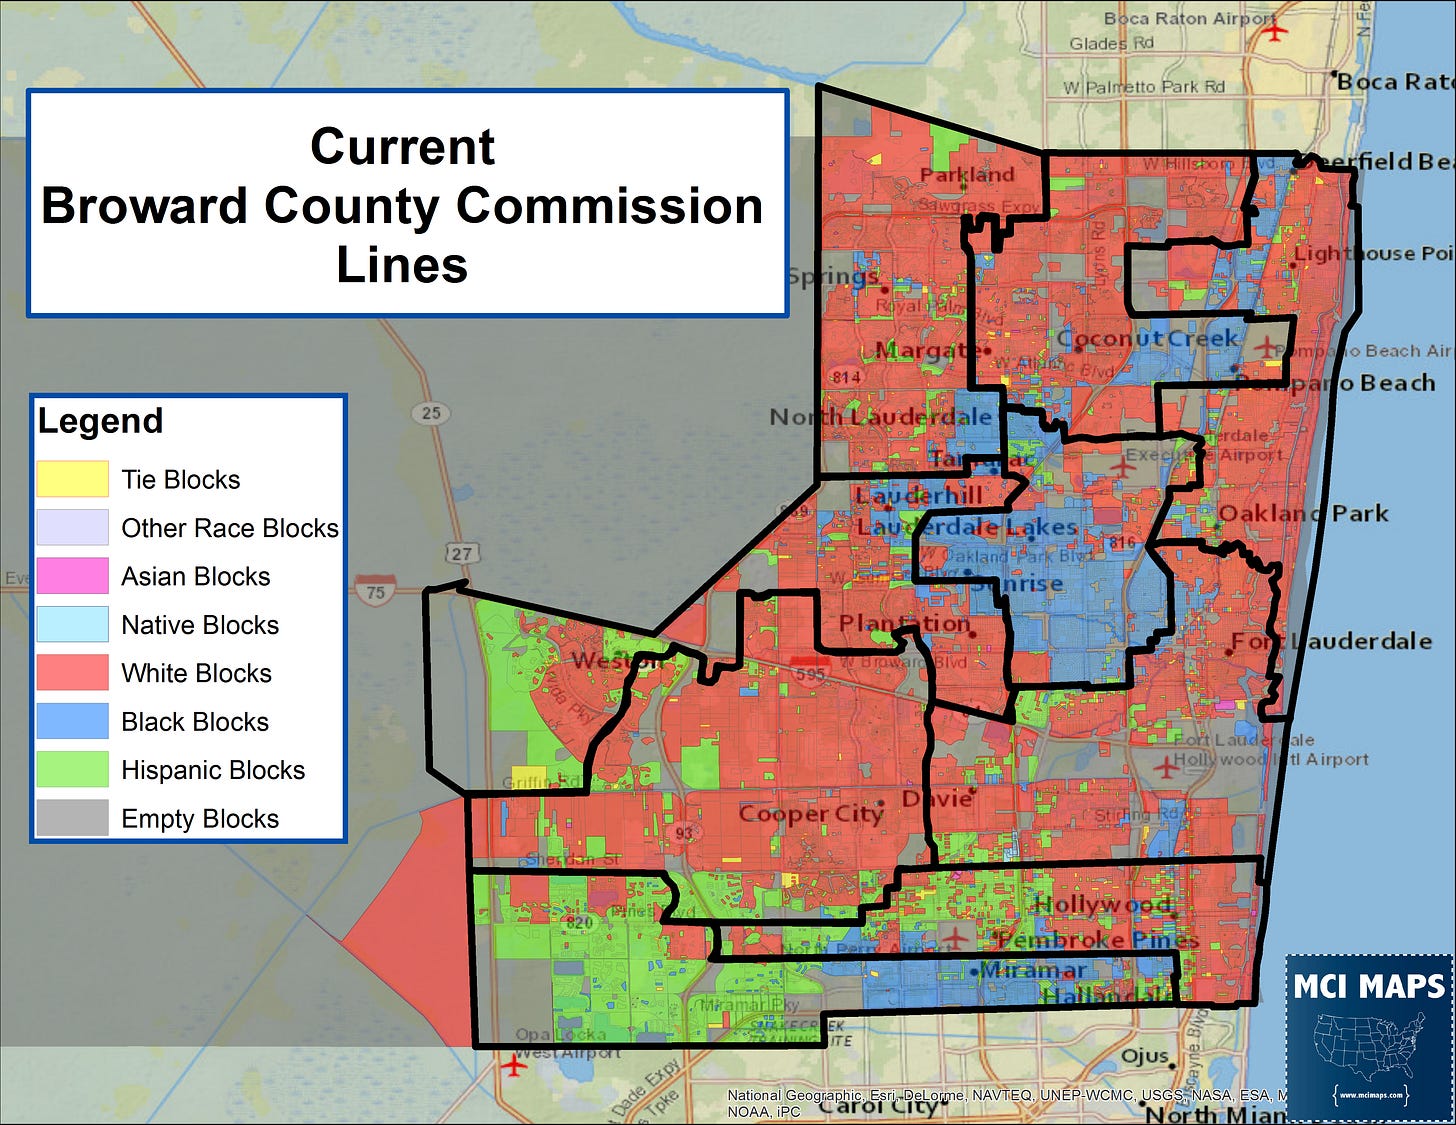
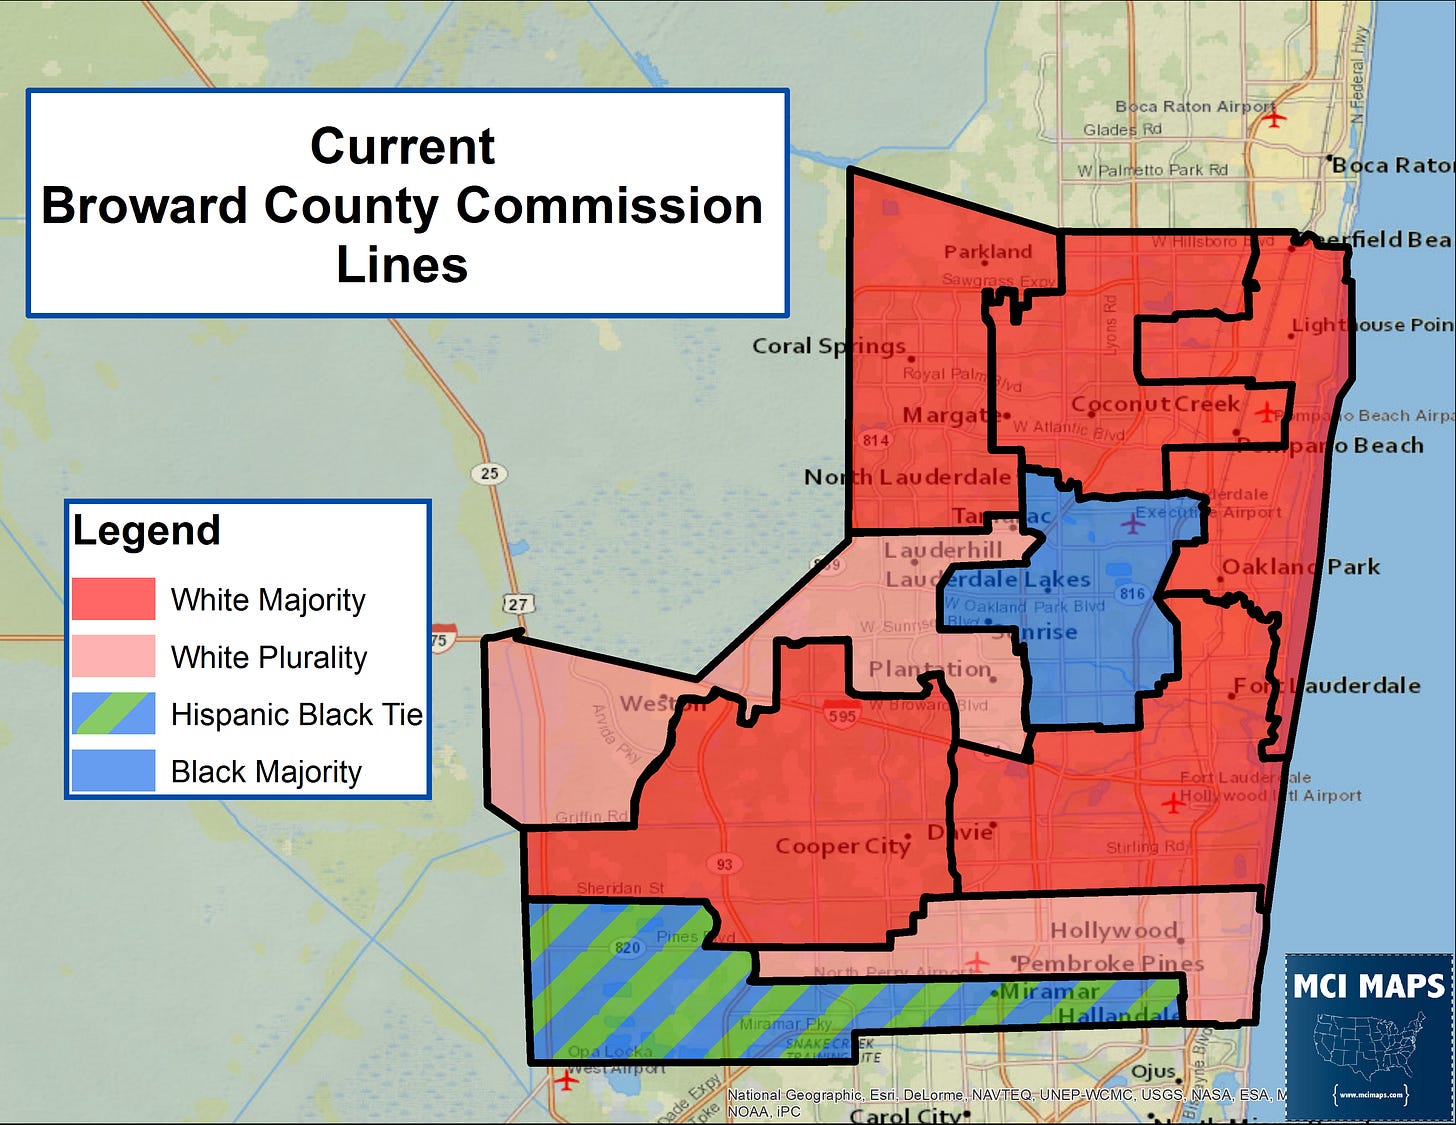
Broward’s commission districts, drawn a decade ago, were designed by the commissioners in office at the time. The Fair Districts rules that guide the state redistricting process did not apply to county commissions. Broward’s commissioners, with open desire to preserve their seats, drew lines to aid themselves or allies. As a result, the lines above are what we got.
Thanks to that process, the commission lines did nothing to aid minority representation in a county that was already less than 50% white. District lines cut across racial groups - doing little to create majority or access districts for the African-American or Hispanic population. I railed against this 8 years ago (pardon the old maps).
The map preserved one black district in central Broward, and pitted Hispanic and Black voters against each-other in a southwest district. (Again, 8 year old map).
Through the decade, the map resulted in a static map of 7 white commissioners and 2 black commissioners. The southwest 8th district, while fairly split between Hispanic and Black voters, consistently performed as African-American thanks to turnout dynamics (more on that later).
Despite the growth in the county’s minority community - especially in Caribbean and Hispanic populations - the commissioners only drew lines to help themselves.
This time, however, things could be very different.
Reform and New Demographics
The anger at the 2011 redistricting process gave reformers motivation to make sure the next process was better. In 2018, the Broward Charter Review board put two redistricting measures on the ballot. One banned political gerrymandering and demanded the process for drawing lines be given to a university. The second ordered maps be drawn in public. Both of these measures got over 73% of the vote.
As a result, Florida International University has been selected to draft the districts. The folks involved are currently accepting map submissions, comments, and are doing a tour where residents can come and speak. Website here.
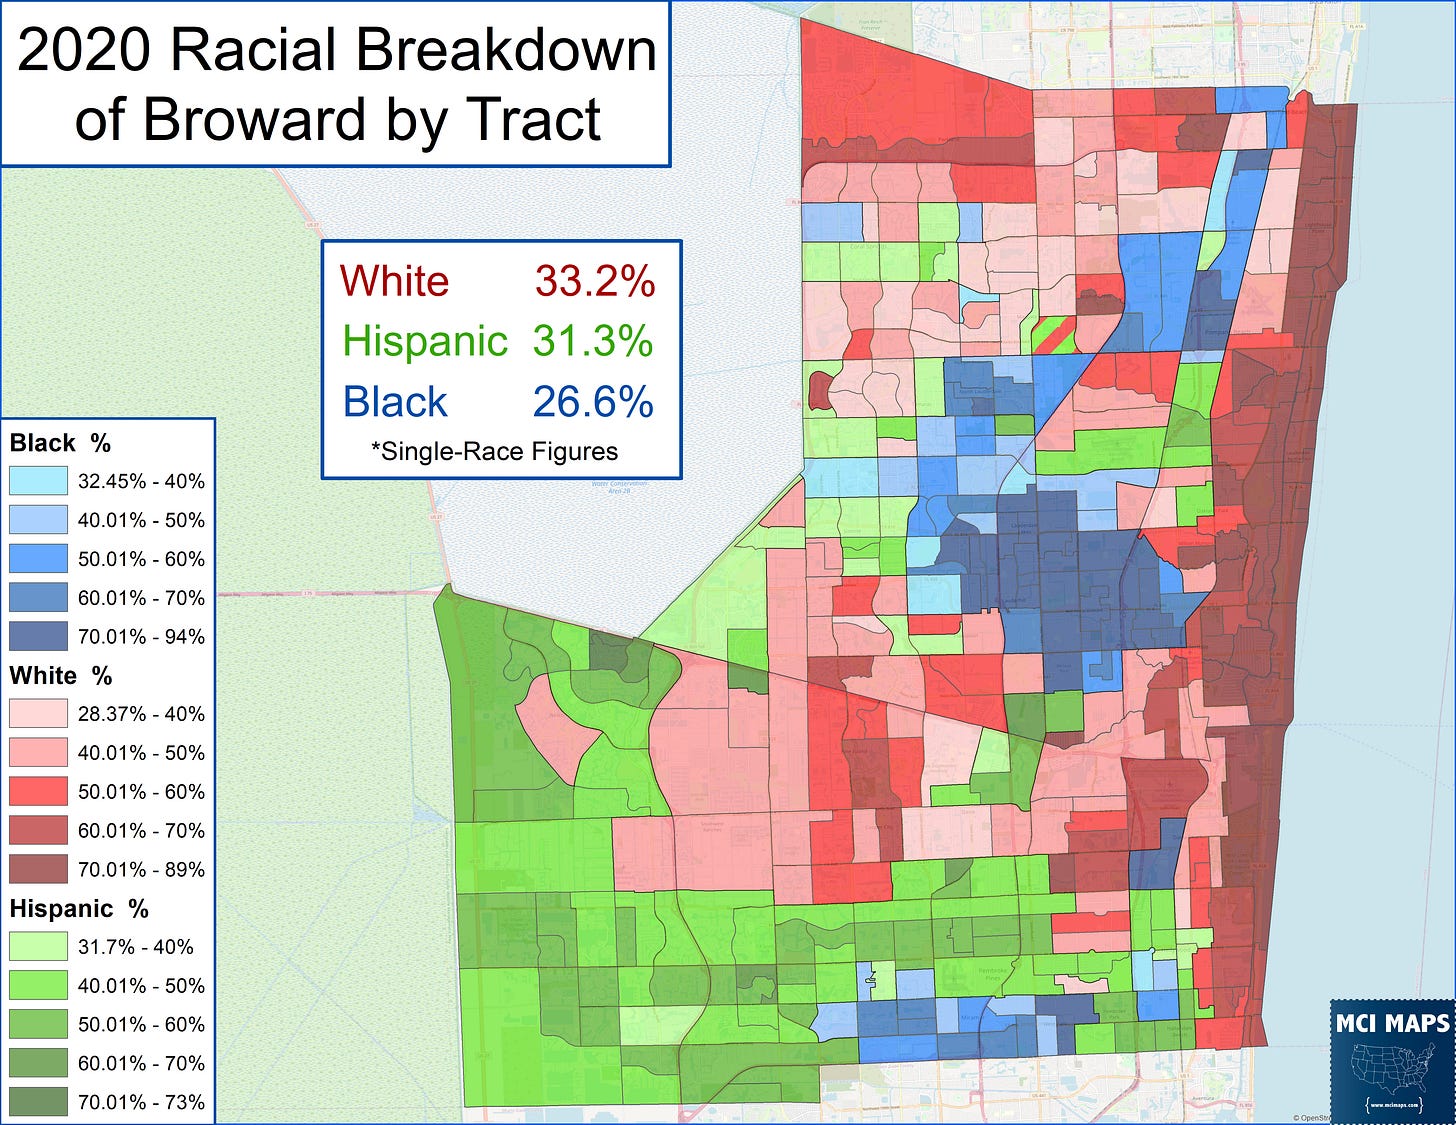
After COVID-related delays, we finally got the census data for Broward. The figures showed a county nearly evenly split between racial groups.
Broward is more diverse than ever, with Hispanic voters very close to passing white voters as the largest racial group. Between these figures and the new redistricting process, Broward could see a massive shift in its map.
My Proposal
The FIU team are welcoming submissions, and of course I just have to submit a plan. This is my home county, after all. Also I’m a know-it-all who has to make my opinions known on everything.
(Important Note - yes I have done political work in Broward and know commissioners and politicians there. I have purposely not discussed this with any of them and I bet this plan pisses off some of my friends. It is a map I believe in.)
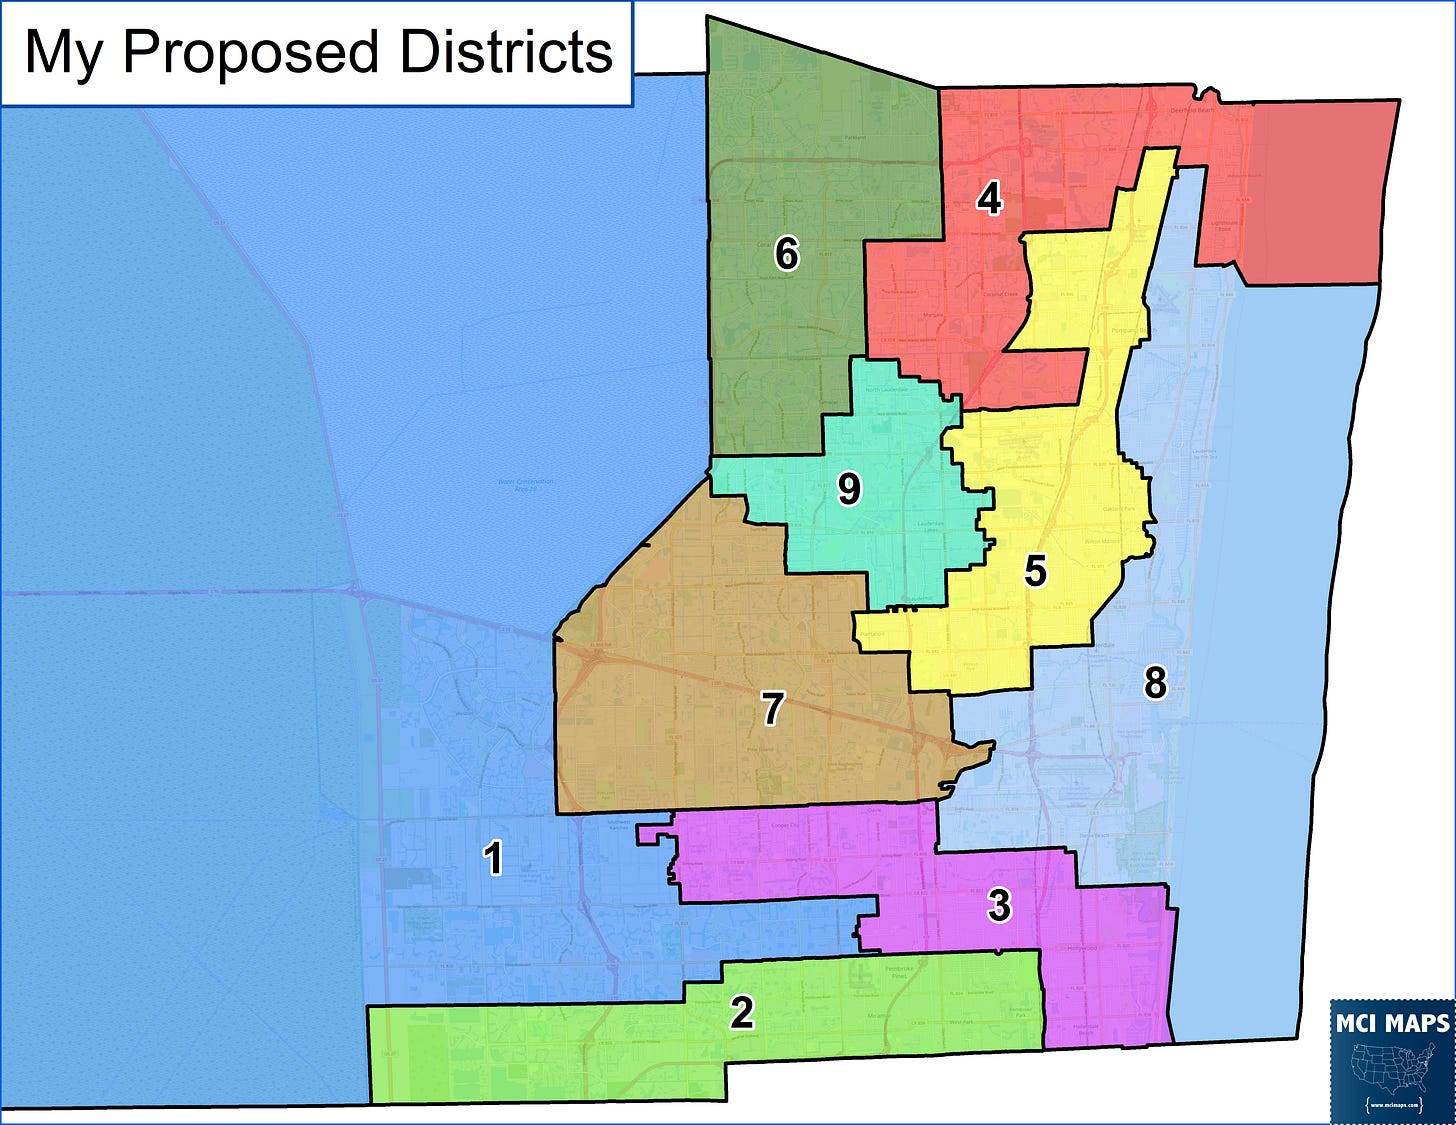
My proposal is below.
So what were my metrics here? My #1 goal was to improve minority representation in the map. My #2 goal was to work along city lines when possible.
The racial makeup of my plan is below. District 1 becomes a majority Hispanic district while districts 5 and 9 are majority-black. District 2 is split between Hispanic and Black residents, but would very likely perform as an African-American seat.
In this proposal, only one district is majority-white.
City lines and major roads were a secondary consideration. How the lines match with city borders is below.
The map fixes one issue that black residents and activists hated about the 2011/2012 map - only one black district in central Broward. Even at the time, a second black district could have been drawn in the area. Instead the map packed black voters into district 9 and split the rest of the residents among other districts. This also resulted in a district that pitted the growing Caribbean population vs the non-Caribbean black residents.
This divide was most visible in 2016. African-American State Senator Chris Smith challenged incumbent commission Dale Holness, who is Jamaican, in the Democratic primary for Commission District 9. While the two differed on many issues, the results fell on notable ethnic lines.
My proposal makes district 9 much more centered in the Caribbean population. District 5, meanwhile, goes along a corridor of black voters that stretch from Ft Lauderdale and into Deerfield Beach.
Now lets talk about south Broward. However, to dig into my decisions there more, we need to start looking at political performance.
Census vs Voting Data
Earlier this year, the Sun Sentinel ran an article on possible commission district changes. An important issue brought up in that piece was census data vs political performance. Read here.
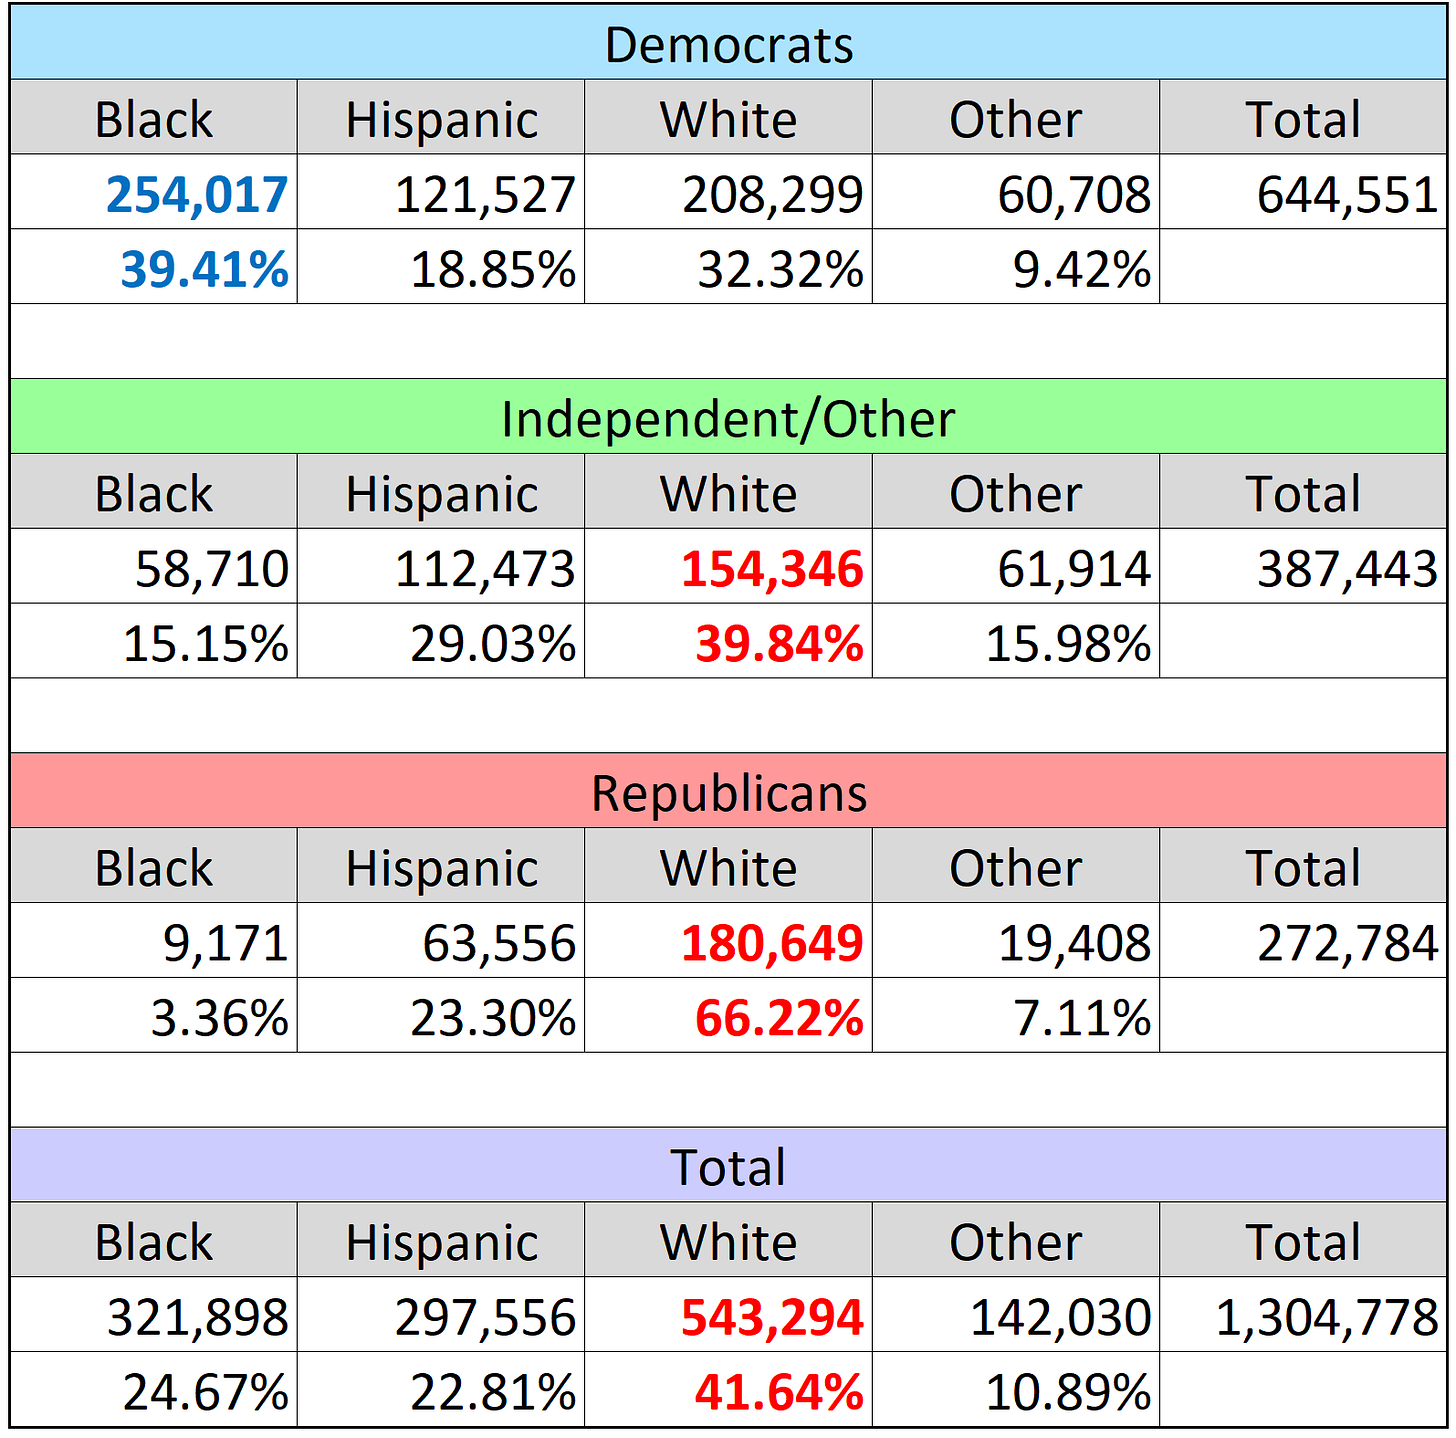
The biggest issue for Hispanic representation in Broward is voting power. Hispanics are registered at lower levels than their census figures. While 31% of the county is Hispanic - only 22% of its registered voters are. They are also spread out across the respective political parties.
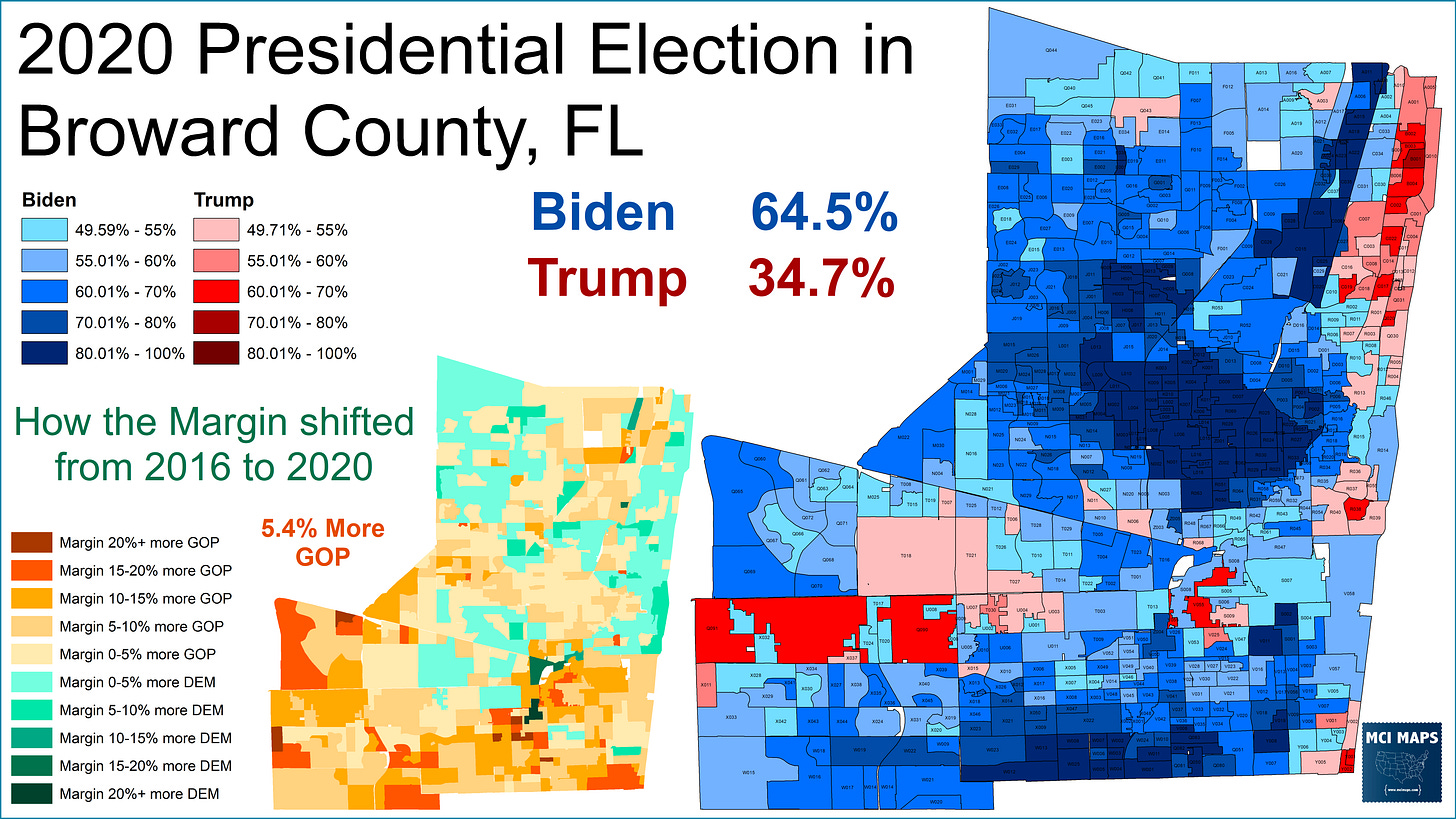
Broward County, as noted, is an overwhelmingly Democratic county. Florida, as most of you know, is a closed-primary state. That makes these Democratic figures the most important. Right now, the Broward commission is 9-0 Democratic. They had one Republican commissioner, now-Rep Chip LaMarca, from 2010-2018. By and large, however, we are going to be talking about a 8-1 or 9-0 map - gerrymandering or not. My proposal is 9-0 Biden vs Trump.
Drawing a Trump district actually requires effort. If you just map and never turn the political data on, you easily end up 9-0. That is how bad it is for Republicans here.
So when looking at a possible map, the racial makeup of the Democratic voters is important. When drawing my lines, I took this into account. This is known as “Functional Analysis” - which you can read about here and here. Short answer - its using political data NOT to benefit one party - but rather to test the political strength of a minority group.
Below is a map of the racial makeup of registered democrats - overlaid with my proposed districts.
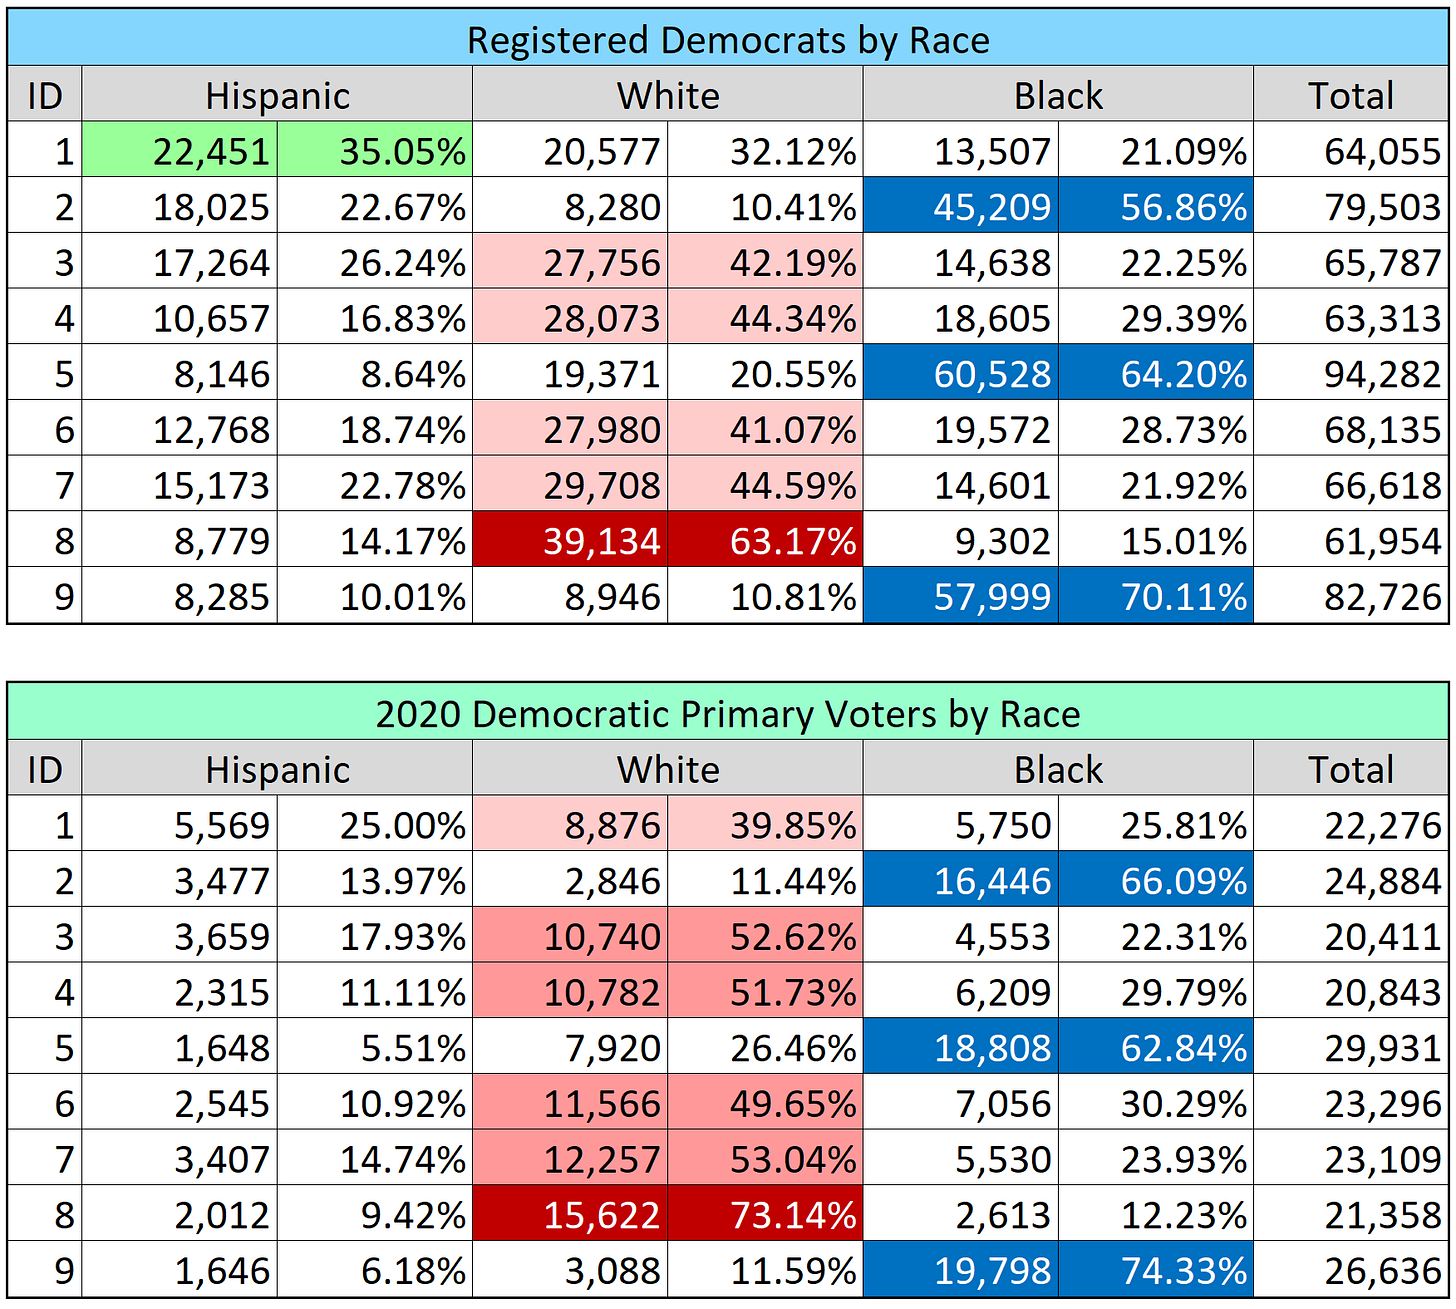
My decisions around District 1 make a good deal of sense based on the map. Rather than go south and grab the southwest end of the county (as I’ve done in past proposals) - I realized going east through Pembroke Pines allowed for grabbing more Hispanic Democrats - increasing that district’s Hispanic influence.
Registration isn’t the only issue - turnout is another. Unfortunately for Hispanics, their turnout is far lower than African-American and white residents. As a result, the difference in registration and turnout is evident (as seen below).
While my District 1 had Hispanics as the largest ethnic group among Democrats - the story was different when looking at the 2020 primary votes cast.
However, over time these turnout dynamics can change - so they should not be viewed as a locked-in metric. As the table also shows, the 2nd would be heavily black in a primary - meaning we’d have three solidly black districts.
Important Thoughts
So what does this turnout issue mean? It means that a new map may, and perhaps likely, will not result in a massive shift in racial representation on the commission right away. However, that does not change the fact that these lines, or something with a similar result, should be the main goal. Over the next decade, Broward will grow more diverse - and that growth will result in growing political representation. This exact same scenario played out in Miami-Dade decades ago. It is imperative that current representatives do not try and cling to power and fight-off change. Its also important for reformers to not get discouraged about current political dynamics (like weaker turnout) and accept bad maps. We should draw maps with the next decade in line. Set districts up to become new minority seats 4 or 6 years down the line. It is time for Broward to be aggressive and forward thinking.
In other words.


